

Guides to Quality in Visual Resource ImagingJuly 2000
In 1998, the Digital Library Federation, the Council on Library and Information Resources, and the Research Libraries Group created an editorial board of experts to review the state of the art in digital imaging of visual resources (original photographs, prints, drawings, maps, etc.). While sources for instruction in digitizing text or text and images existed and were growing, none specifically addressed the challenges of two- and three-dimensional, as well as color-intensive, materials. Charged to identify imaging technologies and practices for such visual resources that could be documented and recommended, the board arrived at a set of guides in the science of imaging-objective measures for image qualities and how they can be controlled in various aspects of the imaging process. With detailed outlines created by board members, DLF and CLIR commissioned board-recommended authors, and have published the guides on the Web with RLG. These five guides are designed to serve the growing community of museums, archives, and research libraries turning to imaging as a way to provide greater access to their visual resources while simultaneously preserving the original materials. They will be updated periodically. Your comments are encouraged by DLF and RLG. Museums, archives, and libraries worldwide are converting visual resources into digital data, and in each case managers of those conversion programs face the same series of decisions about how to create the best possible image quality. These guides bring together the expertise and experience of leaders in the field of visual and color imaging and make their knowledge widely accessible. The guides are written for those who have already decided what they will digitize and what purposes the digital images will serve. After the often-complex matters of selection have been settled, these guides address the steps to successfully create and store high-quality digital masters and derivatives. They include project planning, scanner selection, imaging system set-up, and the resulting digital masters. Guide 1, planning, underscores the importance of defining the users' needs and requirements before undertaking the project. Best practices in digital visual resources include creating images that meet quality and use objectives and documenting how the image being delivered was created. Guide 2, finding the right scanner, starts from a knowledge of the source material to be scanned and, by looking at how to interpret product specifications and employ verification tests, equips users to evaluate new machines as well as those now on the market. Similarly, for setting up the larger system of scanner, camera, operating system, and image-processing software, guide 3 provides information, techniques, and procedures that can be used now and into the future. Guide 4 deals with digital masters, focusing on developing 'visual literacy' in digital imagery and quality assurance; and guide 5 addresses the effect that different file formats-the containers-have on the performance and persistence of digital masters over time and technological change. While there are few universally applicable answers to the questions faced by those who plan and carry out visual imaging projects, the writers of these guides identify critical decision-making points and offer concrete guidance based on the purposes of the images. Where possible, they provide objective measurements of image quality. At the same time, they flag areas where further research and testing are needed before specific practices can be recommended. Each guide is a module that can stand on its own to be mined for information. As a set, the guides provide guidance on how to find what you need to accomplish your stated goals with the available technology, whatever its state of evolution. And they help to clarify the consequences of trade-offs that all managers must make to stay within their means. In providing this framework, from planning to digital output and perpetuity, this publication is intended to offer value both to practitioners and to those who must judge whether a digital imaging effort is feasible, well planned, and worth supporting. Guides to Quality in Visual Resource Imaging
|
||||||||||||||||||||||||||||||||||||||||||||||||||||||||||||||||||||||||||||||||||||||||||||||||||||||||||||||||||||||||||||||||||||||||||||||||||||||||||||||||||||||||||||||||||||||||||||||||||||||||||||||||||||||||||||||||||||||||||||||||||||||||||||||||||||||||||||||||||||||||||||||||||||||||||||||||||||||||||||||||||||||||||||||||||||||||||||||||||||||||||||||||||||||||||
| Staffing | Description | In-house project | Outsourced project |
| Project managers (internal) | Internal project managers are required to manage project goals and institutional expectations, identify staffing and equipment costs, coordinate archival and access needs across departments, and adapt the digital plan as necessary to achieve success. | x | x |
| Vendor project managers | Vendor project managers run the digital operation and allocate appropriate staffing and expertise to the project. | x | |
| Photo services staff | Institutions with an internal photo services division should use it to manage, operate, and maintain the digital project. If the project is outsourced, photo services staff must closely interact with the vendor. | x | x |
| Curatorial and archives staff | Internal curatorial or archives staff members, or both, identify project goals, choose objects for digitizing, identify preservation concerns, and project the short- and long-term uses for the digital images. | x | x |
| Conservators and preservationists | In-house conservators or preservationists should review the project before it begins and identify conservation and preservation concerns. | x | x |
| External consultants | External consultants may advise on digital studio setup, system integration and networking concerns, archival storage issues, color-management needs, and other matters. | x | x |
| Grant writers | Grant writers may be needed to write proposals to secure funding for the project. | x | x |
| Computer/technology staff | Computer and technology staff set up the system, resolve network issues, design storage systems, and performs similar tasks.An institution that does not have these resources must secure outside resources to set up the computers and networks and to handle maintenance. | x | x |
| Preparators and art handlers | Preparators and art handlers prepare and transport objects to the studio for digitizing. An institution dealing with surrogates may not require this type of staff. | x | x |
| Quality and production managers | These supervisors set and maintain image quality-control standards and production goals. Their functions should be separate from those of the scanner or camera operators and technicians. | x | |
| Scanner or camera operators and technicians | Scanner or camera operators and technicians capture and edit the original object or surrogate. | x | |
| Post-processors | Once a digital image has been captured, it is passed to a post-processor, who processes it on archival storage mediums and prepares it for short- and long-term use. | x | |
| Administrative assistants | Assistants create and maintain archival logs and keep track of the metadata information to ensure that the digital process is documented and that the documentation can be searched for easy retrieval. | x | x |
| Vendor services for digital capture, post-processing, and administering logs | Significant vendor costs will be incurred for digital capture, post-processing, administering logs, and equipment use. Often this cost is subsumed in the per-image cost. | x | |
| Equipment | |||
| Digital evaluation costs | Before the project begins, one has the option of renting digital equipment (e.g., digital camera backs, flatbed scanners, and lighting) for testing and evaluation or setting up tests at the outside vendor location. Note: Some institutions may decide not to test as this can be expensive and time-consuming. | x | x |
| Digital capture equipment | Equipment must be purchased to digitally capture the original object or surrogate. | x | |
| Copystand or cradle or flatbed scanner | If using a digital camera back (attached to a traditional camera), one needs a customized copystand or cradle to hold the object being captured. A flatbed scanner must be set up properly or customized for the project. | x | |
| Computer equipment and server setups | Image processing computers capable of high-volume data throughput are the backbone to the digital capture, post-processing, and editing stations. They are also needed for the administrative stations, and to review and check image quality, keep metadata logs, and retrieve images from the archive. In addition, servers are needed for networking the computers within and outside the studio. The number of computers required depends on whether this done in-house or is outsourced. | x | x |
| Lighting | The appropriate lighting for digital capture (e.g., halogen, HMI, strobe) must be chosen. | x | |
| Voltage regulators | Voltage regulators are required to control fluctuations in scanning caused by lighting or electrical jumps. | x | |
| Lightbox | A lightbox is used to view and compare originals or surrogates with the digital images. | x | x |
| Conservation items for the studio | Conservation items include air filters, air conditioners, white gloves, and lab coats. | x | |
| Color management controls | Tools for controlling color management in the studio include targets, gray-scale and color bars, densitometers, calibration equipment, and profiles. | x | x |
| Post-processing equipment | Post-processing equipment includes tape drives and CD burners. | x | |
| Archival storage mediums | Equipment used to archive the digital images includes CDs, tapes, and near-line network storage. | x | x |
| Transfer mediums | Equipment such as ZIP, JAZ, and intranet or Internet connections is needed to transfer images outside the studio. | x | x |
| General supplies for digital capture | General supplies include extra light bulbs, storage disks, and office materials. | x |
Regardless of whether the work is done in-house or is outsourced, a significant number of in-house staff members are required to manage the project. In addition, over time, the cost of vendor project management and outsourced digital capture and post-processing services can equal or exceed costs of an in-house project.
Many of the costs noted in Table 1 will be incurred at the beginning of the project. Once the project is under way, most of the expenses are for maintenance and support to sustain the operation. Digitizing is labor-intensive, and a project involving a large quantity of materials (thousands or millions of objects) can take years to complete. Ongoing maintenance may include the following:
- paying staff or vendors to capture and archive the images;
- upgrading digital and computer equipment annually or biannually;
- paying unanticipated expenses as the project matures, such as expanded outside vendor services, consultants, and additional staff or equipment; and
- weekly technical maintenance on imaging computer equipment, system integration, networking, and archival storage system management.
2.5.2 Managing Cost Implications
Because funds are finite, it is useful to ask whether compromises can be made in any area. The answer depends on the details associated with the project's scope, its intent, and the nature of the source originals. It is important to be informed about the consequences of cutting costs in various ways and to be aware of the costs associated with every aspect of the imaging process.
Although the expenses for digital projects may seem overwhelming, there are serious implications to cutting corners. A decision to reduce spending in one area can adversely affect other aspects of the project. For example, if an extra staff person or extra computer is cut, production will be slowed, other things being equal, and this will cost money in the end. Although cutting costs may appear to be a straightforward task that is based on a cost-benefit analysis, it could be difficult to calculate long-term revenue 'lost.' Managers should have several projected scenarios of long-term revenue figures; this will enable them to consider the consequences of cutting costs on the basis of alternative assumptions.
If one cannot afford all the costs up front, it will be necessary to determine how many images can be digitized per year without sacrificing quality and then to designate a longer period to complete the project. It is better to set modest goals than to create unrealistic expectations. Unforeseen expenses are inevitable and may occur as early as the first three months of production. They must be borne in mind when projecting how long it will take to digitize the source material and the costs associated with that length of time. Often, if a projection is evaluated during the stages of testing and evaluation, the project manager will have a general idea of how best to budget for a project. Spreading out the cost over several years can often fit nicely into a funding proposal.
2.5.2.1 Quality versus quantity
A common issue in managing the finances of a digital project is how to achieve the proper balance between quality and rate of production. Cutting corners in quality creates the risk of having to re-digitize some images, and this risk should be minimized. It is always preferable to reach a well-defined and objective measure of affordable quality, as defined not only in terms of image resolution but also in terms other metrics. The whole image processing chain has to be examined. Besides issues concerning the system for digital capture, one should review compression, file formats, image processing for various uses, and system calibration (Frey and Reilly 1999).
Objective measures for defining a level of quality are useful for documenting how the source material was captured, in terms of tone, detail, noise, and color reproduction (Frey and Reilly 1999). Other standards, such as those related to using a consistent file size and format and recording the digital camera settings, can also be valuable. New formats such as Tag(ged) Image File Format (TIFF) and encapsulated postscript (EPS) will automatically embed the scanning device information into the image file. Given the range of standards that have emerged, the learning curve for selecting appropriate standards can be steep, and seeking the help of a consultant can be expensive. Nevertheless, the organization that has used standards will have greater assurance that the source material being digitized today can be migrated properly and used in the future. The standards must be documented so that the person who wants to use the digital images years from now will have measurements to return to. Organizations that are using an outside service should make sure the vendor provides this documentation with the digital image.
Quantity, or achieving a desired rate of production, is also important to a successful project. An efficient workflow can raise quantity without sacrificing quality because it minimizes disruptions in flow of digital capture, editing, and processing. This translates into better handling of objects and scanning-operator satisfaction, as well. Understanding efficient workflows will help in evaluating both in-house processes and outside services. Achieving an efficient workflow is discussed in more detail in Section 4.3.
2.5.2.2 File size
It can be quicker to capture low-resolution files. They are appropriate if the use is limited to a quick identification shot. However, if the goal is to create an image that can be archived for many uses, there are other factors to consider regarding image capture. Does capturing a midsized file (e.g., 18 MB), as opposed to a high-resolution file (e.g., 70-100 MB), save time and money? Ironically, such a difference in capture size does not significantly change the number of images one can capture per day or per week. This is because most of the time is spent setting up the shot, editing the work, processing images on storage mediums, backing up the files, and changing the camera. This is the case for in-house as well as outsourced services. Therefore, it is often advantageous to digitize at the higher MB size, assuming one's goals for size are not excessive (with available technology, anything larger than 100 MB per image may affect production goals).
Regardless of what size is to be captured, an analysis of server systems and storage-management schemes for backup and archiving is necessary to determine the potential costs of storing and migrating these files. It takes longer to open and edit a large image file than it does a small image file. It also takes more time to view multiple images simultaneously when files are large. Therefore, there are cost implications in terms of computer upgrade requirements of RAM, VRAM, additional hard drive space, and processing power. (Larger file sizes will cause similar problems in a networked environment as well.) Often, additional computers are needed to isolate the tasks of capturing and editing large files so that the computers can efficiently handle the imaging tasks pertinent to large files. Because additional computers, upgrades, or network needs can become necessary sooner than is expected (often within the first three months), it is wise to budget funds for such expenses.
2.5.2.3 Computer costs
Unplanned computer costs often relate to managing the image workflow in the studio and are based on problems that arise during the production stage. The following scenarios describe unexpected computer problems that would incur additional costs:
- Scenario 1: The scanning and editing computers are incompatible and cannot pass images properly from one system to another. Additional costs are incurred for technical help and possible restructuring, such as adding or subtracting computers in the workflow.
- Scenario 2: The amount of data being produced is causing the computers to fragment on a weekly basis. Costs such as those in scenario 1 may be incurred.
- Scenario 3: One or more computers crash for an undetected reason, stopping scanning for several hours. The technician recommends buying a new computer and isolating it from the production loop.
3.0 Analyzing Characteristics and Conditions of the Source Images
As discussed in Section 2, a complete needs analysis addresses the scope and goals of the digital project. But the best-laid plans can go awry if the characteristics and conditions of the original or source surrogate are such that they prevent digital capture. An assessment of the source images includes an estimate of the number of objects to capture, examination of their formats and characteristics, identification of the critical features that need to be retained (e.g., detail and pictorial content), and an evaluation of their condition and disposition (to decide, for example, whether to retain or dispose of the 'original' source material). The results of this analysis will affect the decisions about handling the originals during digital capture, the methodology to choose (e.g., whether to capture from the original or from the film intermediate), and the appropriate digital equipment for the image quality required. [6]
3.1 Estimating the Number of Images to be Captured
The total number of objects to be digitized is actually less important than the number of works of a particular source format to be digitized. In a hypothetical collection of 50,000 works, 5 percent may have existing film intermediaries (i.e., slides, transparencies, or copy prints) while the rest are original materials. Of the original materials, most are 8' x 10' silver gelatin prints, and the rest are oversized (30' x 40') color photographs or daguerreotypes. These numbers suggest that scanning existing film intermediaries would complete only a small percentage of a project. The project manager needs to decide whether to create new film intermediaries for 95 percent of the originals and then scan them or to capture directly from the original materials. The latter would require equipment capable of handling the various sizes, and this, in turn, affects the selection of equipment.
3.2 Source Formats: Film Intermediaries Versus Original Sources
In analyzing the condition and characteristics of the source to be digitized, it is important to consider its format. When scanning from intermediaries, the formats could include slides, transparencies, copy prints, and microfilm. When digitizing from the original source material, it is necessary to determine whether the originals are black- and-white or color photographs, glass-plate negatives, drawings, prints, or maps.
When film intermediaries are being scanned, it is necessary to identify the quality of the intermediaries and determine whether they will be retained after the digital files have been created. In some cases, the film intermediary is retained because of its archival value, and a digital copy is created for access for use alongside the film intermediary. While it is common to retain both film and digital versions when the film is deemed to be the preservation copy (Chapman, Conway, and Kenney 1999), it is also common to retain them when the film intermediary itself is the collection (e.g., a slide collection) and is significant because it is the original material. Film intermediaries are also retained when the purpose of creating the digital file is simply for access because it lacks sufficiently high resolution for long-term archival storage.
For institutions that are digitizing original materials for long-term archival storage and access, however, the role of the film intermediary as an appropriate surrogate has come into question. Should one digitize from the film intermediary or from the original material? After being digitized, is the film intermediary retained only as a backup to the digital file? If good film intermediaries exist, they are often scanned before one decides how to digitize the rest of the material. Scanning from an existing film intermediary is useful because the original need not be physically handled, but it does require that the film intermediary be of good quality (not faded or scratched) and of first-generation (Ester 1996, as quoted in the Image Quality Working Group 1997).
In cases where no intermediary exists, one must decide whether to digitize from the original, using direct digital capture, or to use traditional photographic equipment, create the film, and scan from the film. Scanning from film is no longer considered the optimal solution for digitizing original two-dimensional works, for two reasons. First, creating photographic intermediates entails the significant added cost of making a good photographic copy. Second, with the advances in digital capture, one can now create a digital record of equal or better quality than film and thus bypass the use of film entirely for two-dimensional objects. Moreover, keeping a film copy of the digital file for comfort purposes is neither necessary nor financially justifiable, except in preservation projects where the film is produced with a specific purpose in mind. Direct digital capture requires an investment in equipment and upgrading studio space that may be initially costly. Nonetheless, after the initial investment is made, the institution can be self-sufficient and build internal capability. If initial investments are prohibitive, then one can consider outsourcing: commercial operations can provide studio setup, staff, and rental equipment if the transport of objects is feasible. Sometimes it is possible to develop a digital studio gradually. Much of the photographic equipment from the traditional studio, such as cameras, lighting, copystands, light meters, and densitometers, can be used in the digital studio.
3.3 Size of the Source Originals
The size of the originals influences the equipment used for digital capture. It may be necessary to adjust or customize the equipment to accommodate the size of the materials. Often, a copystand has to be configured to help maintain the physical relationship of the parts to the whole (as in the case of scrapbooks, albums, and sketchbooks). Working with vendors, institutions have found ways to create cradles for fragile materials or expand the size of the scanning table to accommodate oversized works. Specific considerations relative to size are discussed in the next section.
3.4 Unusual Characteristics and Features
Analyzing the unusual characteristics and critical features of the source material can help determine the best way to develop specifications for digital capture. The following examples provide general guidelines for analyzing materials that vary in size, have physical relationships to a whole, have mounts or mats, or are oversized.
3.4.1 Varied Sizes
Original items that vary in size can be difficult to digitize. The following questions are relevant:
- Will it be difficult to find similar items to group together for capture?
If the objects to be digitized are not similar in size or type, production will be slowed. Rearranging the setup for capture (i.e., moving the camera, changing the lighting, or adding filters) takes time. - What type of setup is required to accommodate objects of different sizes?
Is a larger or wider digital capture table needed? Is there enough storage and staging space to arrange the objects according to size, material, or status (e.g., those captured or edited)? - What file sizes should be considered to accommodate original objects in a range of sizes and shapes? If one opts to capture objects within a particular range of sizes without moving the camera, the file size will have to vary. Additionally, many objects are not proportionately equivalent to the square format of many camera backs. To include all information of that object, one should consider the usable pixel areas of the scanback to determine if it meets one's requirements for file size. (Landsberg 2000).
3.4.2 Physical Relationships to the Whole
When digitizing materials that have physical relationships to the whole, care should be taken to maintain those relationships. For example, when capturing an album, the following issues must be considered:
- What is the relationship of the parts to the whole? Can each page be captured separately, or does one have to accommodate a binder and therefore capture two pages at once?
- Does the album need to be cradled to minimize stress on the binding?
- Do the album pages have intrinsic significance, or is it sufficient to capture the images from each page? Is there a relationship between the spreads that should be maintained, or is an indication of sequence enough to recreate the experience of looking through the album?
3.4.3 Mounts and Mats
Institutions digitizing items that are mounted or attached to mats (e.g., photographs, drawings, or prints) should consider these features in the digital capture process. The following questions should be considered (Hermanson 2000):
- Can the object be safely and easily removed from its mount or mat for capture? If not, can the object be captured while attached to the mount or mat?
- If the object needs to be removed, at what level do conservators, framing personnel, or preparators need to be involved? Who can remove an object from simple paper corners? What about slitting hinges or removing other mounting techniques?
- Is an original mount to be treated as part of the object, and, if so, should it be included in the scan in its entirety?
- If the artist has indicated that a work should be cropped, should the scan reflect this?
- If the original material must remain in its mat, what type of physical adjustments does this require? For example, a copystand or scanning table that can accommodate an open mat may be needed. What kind of scanning complications might arise from reflections off this open mat?
3.4.4 Oversized Materials
Digital capture of oversized materials presents the following challenges:
- What type of digital capture device can accommodate an oversized work? Many customized setup solutions are available.
- What kind of lighting arrangements are necessary to illuminate a large object evenly?
- What type of scanning judgments will be necessary to accommodate the critical features? For example, density and type size can vary greatly with oversized materials such as maps.
- What compression issues need to be considered for both archival storage and dissemination to the user? For example, an oversized map of 22' x 27' captured at 300 dpi in 24 bit becomes a 160-MB file (Yehling Allen 1998).
- How will users' access to such oversized, storage-intensive data be facilitated? Some sites provide tiling, several resolutions, and different details of each image. [7]
Columbia and other institutions that scan large-scale color maps continue to investigate how new digital technologies can be effective in capturing unusual characteristics of source materials. For example, the Library of Congress is using a high-resolution flatbed scanner to digitize directly from the original maps (Fleischhauer 1998). The scanner provides a strong dynamic range, a feature that is important for deciphering minute subtleties in tonal detail found in most maps.
3.5 Condition and Disposition of Originals
An analysis of source materials includes an assessment of their condition.
Materials must be examined for cracks, warping, bending, brittle bindings, or losses. Before digitizing, one must determine whether any pre-capture treatments are required. This is important to consider in advance, because after the item captured, as long as the digital archive exists, the digital file will represent the nature of the original, with its inherent cracks and scratches. It is also necessary to determine whether the original intermediate surrogates will be retained or discarded.
The condition of the source material helps determine what methodology is feasible for digital capture. Two-dimensional materials, such as original photographic prints, glass-plate negatives, drawings, prints, and oversized maps, have special handling requirements. For example, photographs are sensitive to light, maps need to lie flat, and albums must be cradled to avoid stress in the binding. The handling of source materials during capture should not exacerbate existing defects. In conjunction with conservationists, curators, and digital photographers, the institution should create guidelines for handling the objects or surrogates, determine transport procedures, and define procedures for capture of unique objects or surrogates that are sensitive or brittle. (A surrogate may be the only record of a visual object if the original no longer exists or is missing.)
The choice of equipment for digital capture depends on how the object must be handled. Flatbed scanners are more commonly used for scanning film intermediaries than for scanning originals. High-end flatbed scanners can produce both excellent resolution and great dynamic range that often exceed the standards set by the archive. Scanners typically accommodate materials of up to 9' x 11', but some scanners have larger beds. These scanners can hold several surrogates at once, leaving room for the placement of gray-scale and color bars as part of the documentation.
When one is digitizing from the original object, a flatbed scanner is not always appropriate because it requires the material to lie completely flat and not to exceed a specific size (DeNatale and Hirtle 1998). This technique may not be appropriate for sensitive materials because an unmatted original would have to be pulled up from the corners as it is placed on and removed from the glass. The flatbed scanner also makes it difficult to control light and ultraviolet levels because the light sensors are often set within the unit and cannot be changed.
Flatbed scanners, however, can be customized in creative ways. Some companies (e.g., Luna Imaging in Venice, California) have devised ways to customize commercial flatbed scanners to accommodate the overhang of the mat on the unit so that original flat works (if measuring 9' x 11' or less) do not have to be removed from their mats.
When digitizing original materials, a better option is direct digital capture, which uses digital cameras or digital camera backs attached to traditional cameras. It offers more versatility for capturing two-dimensional originals (DeNatale and Hirtle 1998). Using digital camera backs to capture the original material replicates the setups of traditional photographic studios. Because the workspace is flexible, sensitive items can be treated individually, lighting can be adjusted for different sizes and shapes, and procedures for handling and capture can be adjusted (e.g., a decision about whether to place glass over an image during capture can be made for each piece). This approach can also accommodate oversized materials, unusually shaped two-dimensional works, or unique materials such as glass-plate negatives.
From the perspective of conservation, the level of light is a critical concern when digitizing directly from originals. Direct digital capture setups require approximately four times more light than does traditional photography. Using customized setups or different lighting solutions, or both, can ameliorate the concerns about excessive levels of light. For example, halogen light produces a great amount of heat and thus is potentially problematic. Some companies have developed light housings that block most of the heat caused by halogen. [8] These specialized halogen methods were used in the Vatican library project (Mintzer et al 1996). Some museums have also evaluated alternative to halogens [9], such as HMI or fluorescent lights, which conservators have deemed acceptable.
4.0 Developing Appropriate Capture Specifications and Processes
Articulating the project scope and goals through a needs analysis, as well as evaluating the characteristics and conditions of the source images, are preliminary steps to digital capture. These activities also specify the appropriate capture specifications and processes. The specifications and processes for digital capture are then implemented and subjected to a technical evaluation.
4.1 Image-Capture Specifications
Image-capture specifications can be viewed as parameters of the following items:
- the maximum file size for the archive,
- the required file sizes for the derivative images to be used for the access projects,
- the image editing rules, such as contrast adjustments, cropping, and dust spotting, that will apply to both the archival and derivative copies (this includes whether to optimize the images during the capture process or whether this optimization is done outside the digital studio),
- the storage format (e.g., TIFF, PCD, jpeg, flashpix) and medium (e.g., CD, DVD, tape) for storing the digital images for archival purposes, and
- the storage format and medium (or network setup) for storing the image derivatives for access.
4.2 Testing and Evaluation
Once parameters have been defined, it is necessary to determine whether the equipment under consideration is capable of satisfying the specifications. In turn, one can use digital equipment to evaluate the appropriateness of the capture specifications. This can be achieved by testing the digital equipment and testing the images for their intended uses before the project goes live. This evaluative phase can also be used to assess quality-control standards and workflow.
Testing and evaluation involve considerations of the digital capture equipment, the level of detail captured, the image capture and editing capabilities, and the image capture rules.
4.2.1 Digital capture equipment
Whether digitizing from film intermediaries or the original materials, the following steps can be taken to compare digital capture equipment (i.e., flatbed scanners, digital cameras, and digital camera backs). The results should determine an appropriate component for the project (Serenson Colet, Keller, and Landsberg 1997-1998).
- Compare price and quality.
- Evaluate software for image adjustments and color-management tools.
- Check for artifacts (defects in the capture equipment).
- Look at the spectral sensitivity of the digital capture device.
- Evaluate speed of capture time and usable exposure time.
- Review lighting requirements.
- Identify handling concerns that the equipment imposes.
- If necessary, consider customized solutions for the digital studio (e.g., for lighting or a copystand that holds the original).
4.2.2 Level of detail captured
Remember that the level of detail to be captured is directly related to the size of the digital file to be archived. When capturing posters or maps with small text where legibility is critical, the equipment will have to accommodate both the size and detail required. Small originals may not require as high a resolution, but the equipment does need to capture a good dynamic range to pick up shadows or minute subtleties in the original. There may be slight differences in the ability of different devices to capture this information.
4.2.3 Image capture and editing capabilities
While testing the equipment, the user should also experiment with the image capture and image editing capabilities such as adjusting contrast and cropping. Images intended for a specific project, such as a Web site, can be optimized for the particular application at the time of their capture. For such applications, the equipment should be capable of generating an optimal capture. However, if one decides to capture the image and optimize it later, the equipment should be able to capture and store information with more neutral controls (e.g., minimal adjustments and without sharpening). The images can then be uniformly changed for the varied applications. This way, they can be used for many purposes and saved without a specific application in mind.
4.2.4 Image capture rules
In the initial stages, deciding upon the image capture and editing rules can be difficult because it requires projecting how the users will use or access the digital images. Consequently, the process is an iterative one, in which images are captured, edited, and tested for their intended use(s) and the feedback from that process is used in the next iterative step. For example, if the images are used for a Web site, it will be necessary to test whether the resolution quality chosen is appropriate for the intended audience. If the images are used for high-resolution printing, one must work with the publications department or printer to perform printing tests of the digital files. Run a press proof to determine the quality of the image and whether it will be suitable for printing to your institutional standard. Whether the project is done internally or with the help of an outside vendor, the importance of these evaluations can not be overstated. Much will be learned during the tests. In fact, one should expect to continue going through iterative processes of testing and refinement even after the project has moved beyond the evaluative phase.
One of MoMA's digital initiatives provides a good example of the importance of testing and evaluation. MoMA's digitization team includes individuals with a range of managerial and technical expertise. [10] In 1997, MoMA embarked on an ambitious project to digitize 25,000 original photographs from the museum's collection. The digitization team used direct digital capture to digitize works of artists such as Edward Weston, Edward Steichen, and Man Ray. No film is used to create the digital reproduction. These digital surrogates are created with consistent standards that are appropriate to the institution's needs for archiving and access. They are used for the museum's Web site, collections- and exhibitions-management system, educational kiosks, and high-end book production. The museum has succeeded in creating digital files that can surpass the quality of film in tonal fidelity, an important criterion for printing black-and-white, duotone, and tritone photographic books. It has also succeeded in creating an archival capture that can be used for many access projects. The key to MoMA's success was the planning, testing, efficient workflow, and immediate use of the growing digital archive for a variety of applications.
4.3 Efficient Workflow
Efficient workflows are essential to the success of digital projects. Digital projects are research projects, but they also have to be productive to be financially feasible. Traditionally, museums, libraries, and archives have emphasized quality and downplayed the importance of production. But unless productivity rates are acceptable, financial investments cannot be realized. Aware of this, many institutions are realizing they can create a good workflow that will maximize the output efficiency of their studios. To do so requires that everything in the studio-the initial handling of original material, the image capture, the image editing, the movement to image storage, and the eventual image transfer for online access-work as a high-quality assembly line. Digital experts can teach us a great deal about production. Süsstrunk (1998) provides a comprehensive case study of a digital workflow production.
The following are recommendations for an efficient workflow.
- Staff the studio with equipment operators who respect the original material but can also work on repetitive production-oriented tasks.
- Set up a physical workspace that is conducive to the safety of the originals and the workers. Digital capture operators should have comfortable work setups when doing repetitive tasks.
- Balance quality controls with production targets for an efficient workflow.
- Chase the bottlenecks in the production flow: as one is removed, another may arise.
- Keep administrative tasks (storing metadata) to a minimum. Unless a dedicated staff member in the studio is assigned to do this in the assembly line, this task should be done outside the studio.
- Consider ways to continue the workflow outside of the studio (storing the master image, disseminating the derivatives, and creating an enterprise-wide solution for archiving and accessing). An institution that is not set up for the massive organization that is required once the digital file leaves the studio, may have to secure outside services for this purpose.
- Organize work in batches (i.e., by size and by like medium) for maximum efficiency
- Determine where the archive will be stored (internally or off-site)
- Determine where the archive will be managed (internally or off-site)
- Determine whether and when to refresh mediums (preparing for migration)
4.4 Documenting the Decision-Making Process
All decisions associated with planning a digital project must be documented. Keeping a record of the institutional and technical evaluations will help future staff members and others understand why certain decisions were made. Making and revising these decisions should be a group effort, because various degrees of expertise are required at various times. One should also document the procedure for handling materials (i.e., the procedure for when the work enters and leaves the digital studio during which it is captured, and the digital file prepared for access and archival purposes). Analyzing this workflow will help identify bottlenecks. The workflow will continually be revised as the team improves or changes methods in the digital studio [11]
It is also important to document what digital and computer equipment is being employed and the particular settings used. This will be helpful when one has to identify problems with the equipment or go through the process of migrating digital files. Knowing how the digital images were created will provide good information when change is required.
It is important to document the following information related to image capture, editing, and processing:
- date of capture
- type of digital capture and its characteristics
- targets used
- density values on gray-scale and color bars
- color-management profiles
- general profiles that connect the digital equipment in the studio
- contrast or color settings used in the imaging software
- type of lighting used in the capture process
- computer equipment used
- file size, format used (e.g., CD, DLT)
- contrast adjustment recorded (e.g., black-and-white point values during image editing)
- file size, medium used for storage and transfer (e.g., TIFF, JPEG)
- notes relating to opening the file, if any
- notes relating to optimizing the file for varied uses (e.g., recording the contrast or color settings used is an important identifier for those who receive the image)
5.0 Conclusion
The products of a digital imaging project can have many different uses. This paper has stressed the advantages of using a use-neutral, rather than a use-specific, approach whenever possible. Creating a high-quality, long-term archive will ultimately help an institution benefit from the investment of time and money that these projects require. The decision-making process must be documented so that particular justifications become explicit when images are used in specific production tasks (e.g., the publication of an exhibition catalog). The following guidelines are offered for documenting the decision-making process for a use-neutral approach:
- Articulate the project scope and assess the characteristics of the source materials.
- Capture at the highest resolution possible within the constraints of the project's resources.
- Store use-neutral image files (i.e., keep device dependent color correction and other optimizations to a minimum).
- When using the stored digital images for specific production tasks, incorporate the post-process optimizations that are specific to the task at hand (e.g., the production of an exhibition catalog).
This guide has covered the process of planning a digital project, from the initial planning phases, in which the scope and goals are defined, to the analysis of source material(s) to be digitized, to the process of defining image capture specifications and image capture procedures that are then iteratively evaluated. If this process is followed closely, the result should be an efficient workflow and a successful digital project.
Footnotes
1. Refer to Stephenson and McClung (1998) and Gill, Gilliland-Swetland, and Baca (1998) for more information on preparing digital images for end uses.
2. Further information about printing from digital files can be obtained from MoMA's Publications Department (M. Maegraith, M. Sapir, and C. Zichello).
3. For a detailed analysis of migration issues, refer to Hedstrom and Montgomery 1998.
4. Süsstrunk (2000) notes the following: 'The dpi resolution indicated by printer manufacturers usually (but not always) refers to the addressable resolution of that printer. That means that the printer can put that many dots of ink on paper per inch. However, the dots on the paper overlap, and the ink spreads depending on the surface characteristics of the paper (uncoated paper induces more spreading, and therefore has a lower resolvable resolution than coated paper). Therefore, the 'resolvable' resolution of a printer is always lower than the 'addressable' resolution.'
5. In spring 1999, NISO, CLIR, and RLG cosponsored the Technical Metadata Elements for Images Workshop in Washington, D.C. that drew digital practitioners from various institutions. The goal of the workshop was to start setting digital metadata standards in the museum, library, and archives communities.
6. The questionnaire featured in Harvard's Image Scanning Guidelines is helpful in evaluating these issues (Technical Working Group, Visual Information Access Project 1998). Refer also to Conway 1999 and Ayris 1998 for further guidelines on assessing source images for scanning.
7. Refer to Yehling Allen (1998) for Internet sites that provide excellent guidance on how to make large images available to users electronically.
8. Tarsia Technical Industries in Fairfield, New Jersey, is one such company.
9. Photographers from the following institutions have been researching alternative lighting solutions for direct digital capture: Kate Keller and Erik Landsberg at MoMA, David Heald at the Guggenheim, Michael Bevans and Andy Proft at the Johnson Museum of Art at Cornell University, and John Wolffe at the Museum of Fine Arts, Boston.
10. The digitization team included digital technicians, the director and assistant to director of photographic services and permissions, the chief curator, assistant curator, chief fine art photographer, senior fine art photographer, publisher, and post processor.
11. For a detailed matrix for decision-making, the reader is referred to Hazen, Horrell, and Merrill-Oldham (1998).
Acknowledgements:
Although the chapter is written by a single author, it reflects the accomplishments and knowledge of the original digital team that forged new improvements in digital imaging at the Museum of Modern Art. These resources may be used to find out up-to-date information about MoMA's digital projects.
- Mikki Carpenter, Director of Photo Services and Permissions
- Peter Galassi, Chief Curator of Photography
- Sarah Hermanson, Assistant Curator of Photography
- Kate Keller, Head of Fine Arts Imaging
- Eric Landsberg, Manager of Imaging Technologies
- Michael Maegraith, Publisher
Guides to Quality in Visual Resource Imaging
2. Selecting a Scanner
Don Williams
© 2000 Council on Library and Information Resources
- 1.0 Introduction
- 2.0 Source Material Characterization
- 3.0 Background and Definitions of Image Quality Features for Scanner Selection
- 4.0 Understanding Product Specifications
- 5.0 Resources and Methods for Image Quality Verification
- 6.0 Scanner Review
1.0 Introduction
What is a scanner? It is more than a beige desktop box or copy stand camera. It includes the related driver software and application programs that manage it. Some may consider this a technicality, but if the history of desktop printers is a harbinger for capture devices such as digital scanners and cameras, then one must treat the triad of hardware, driver software, and application as the scanner. When choosing a scanner, all of them need to be evaluated and treated as a unit. Table 1 presents common attributes associated with each scanner component. Some of these functions may migrate between categories or from device to device. Most of them affect image quality in some way.
| Hardware | Driver Software | Application |
| Light source | Number of bits per pixel | Color management |
| Platen size | Image processing | Compression |
| Scan speed | Productivity | Scripting |
| Optics and optical path | Calibration | File formats |
| Mechanics | Gamma selection | |
| Sensor | Scaling | |
| Power requirements | OCR | |
| Factory support | Raster-to-vector conversion | |
| Electronics path | Page format retention | |
| Auto-document feed (ADF) | ||
| Transparency adapter |
A scanner must be selected in the context not only of the characteristics of the object to be scanned but also of the intended use of the scanned image. There is no sense in purchasing an expensive scanner when the resulting images will be used only for Web site postings. On the other hand, creating digital master files for unknown future uses requires strict attention to detail and an understanding of how image information manifests itself and can be properly captured.
Section 2 of this guide reviews the salient categories of the source materials; namely content, format, and optical characteristics. Section 3 contains definitions of image quality features. These definitions are used as a basis for a discussion of setting minimal scanning requirements to achieve suitable image quality according to source and intent. Resources and methods to measure or judge these image quality features are described at length. Because not everyone is willing to perform image quality measurements on their own, Section 4 presents information on the interpretation of manufacturers' scanner specifications. Examples of such specifications, along with explanations, are included. The guide concludes with a review of scanner types in terms of image quality and implementation features.
2.0 Source Material Characterization
Knowing your collection and understanding the priorities for digitizing it will help you determine the type of scanner to choose. There are four classes of scanners from which to select: film scanners, cameras, flatbed or sheet-fed scanners, and drum scanners. Except for film scanners, there can be considerable overlap in the content, format, and optical characteristics that each type of device can scan. Table 2 presents source material categories according to these three features.
| Content | Format | Optical Characteristics |
| Color Type: -black and white -full color, -monochrome Photographs Text Halftones Manuscripts Line art Art work Mixed |
Size Three-dimensional (3-D) Film (roll or sheet) Bound/unbound Flexible (film)/inflexible (glass-plates) |
Reflection/transmission Surface characteristics (gloss, texture, flat/ wrinkled) Density range Spatial detail content Color dye/pigment gamut Artifacts/condition (e.g., scratched, fragile, torn, bent, faded) |
Some types of scanners are better at capturing certain of these features than others. Benchmarking a scanner with respect to image quality features will delineate these differences. Definitions of these features and techniques for evaluating their quality are covered in the remainder of this guide.
3.0 Background and Definitions of Image Quality Features for Scanner Selection
In its purest form, image quality can be judged by the signal and noise characteristics of the image or scanning device under consideration. The ratio of signal to noise is often used as a single measure for image quality; that is, the greater the signal-to-noise (S/N) ratio the better the image quality. However, because one person's signal is another person's noise, the use of SNR as an image quality metric is difficult to manage. The interpretation of signal and noise becomes too broad and, in turn, ambiguous. S/N can be a useful measure for characterizing scanner performance; however, translating this measure into absolute image quality is difficult.
Consequently, image quality features are dealt with by more tractable imaging performance categories. There are five such categories: tone reproduction, color reproduction, resolution, noise, and artifacts. All yield objective measures that contribute to overall image quality in complex ways. For instance, a viewer does not perceive tone reproduction or resolution but rather the psychophysics of lightness, contrast, and sharpness. He or she then creates a mental preference for the image. Although these categories cannot measure image quality directly, they do serve as a good high-level model for evaluating image quality. The remainder of this section is devoted to detailed definitions of these image quality features. It will serve as a basis for further discussions on specifications and tools for scanner selection.
3.1 Tone Reproduction
Tone reproduction is the rendering of original document densities into luminances on softcopy displays or into densities in hardcopy media. It is the foundation for the evaluation of all other image quality metrics. It determines whether a reproduced image is too dark, too light, and of low contrast or of high, and implicitly assumes the evaluation of neutral gray tones over large areas of an image.
The seductive beauty of a photograph by Ansel Adams or Irving Penn is primarily due not to the image content, composition, sharpness, or low noise but rather to the remarkable reproduction of tones-from gleaming highlights to deep-shadow details, with all tones in between. Tone reproduction is the welcome mat to the evaluation of all other image quality metrics. Although on the surface, tone reproduction seems a simple job of tone management, the subtleties of the viewing environment and cultural and professional preferences often make it an art.
For scanned image files, tone reproduction is somewhat of a misnomer unless a final viewing device is assumed. This is because the capture process in a scanner is simply that-a capture step. It is not a display that reproduces light. Tone reproduction, by contrast, requires both capture and display. How then does one select a scanner to accommodate the best possible tone reproduction when the scanned data generally may be reproduced on any number of display types and for a number of viewing preferences?
Three objective image-quality attributes of a scanner-the opto-electronic conversion function (OECF), dynamic range, and flare-ultimately and universally affect all tone reproduction. The scanner's driver software often controls the OECF; dynamic range and flare are inherent in the hardware.
The OECF is a term used to describe the relationship between the optical density of a document and the average digital count level associated with that density, as detected by the scanner. The OECF is the first genealogical link between an original object and its digital offspring and is usually controlled by the software driver. The extent to which the driver software allows the user to control the OECF and documentation on how the driver software accomplishes this are important features to consider when selecting a scanner.
Dynamic range is the capacity of a scanner to distinguish extreme variations in density. As a rule, the dynamic range of a scanner should meet or exceed the density extremes of the object being scanned. Because specifications for dynamic range are frequently overstated, the means to objectively verify these claims should be at hand. This will be covered in Section 4.3.
Flare is non-image-forming light with little to no spatial detail content. It manifests itself by reducing the dynamic range of a device and is generally attributed to stray light in an optical system. Documents in which low densities predominate and devices requiring large illuminated areas, such as full-frame digital cameras, generally suffer from high flare. These two conditions should be kept in mind when selecting a scanner. Whenever large amounts of light, even if outside the scanner's field of view, are involved in imaging, flare may become a problem.
See also, Tone Reproduction, Guide 4.
3.2 Resolution
Resolution is the ability to capture spatial detail. It is considered a small-area signal characteristic. Before the advent of electronic capture technologies, resolution was measured by imaging increasingly finer spaced target features (that is, bars, block letters, circles) and by visually inspecting the captured image for the finest set of features that was detectable. The spatial frequency of this set of features was considered the resolution of that capture process. Measured in this way, resolution values depended on the target's feature set, image contrast, and inspector's experience. The units used for reporting resolution were typically line pairs per millimeter.
The resemblance of these units to the spatial sampling rate units of a digital capture device is unfortunate and continues to be a source of confusion about just what resolution is for a digital capture device. For digital capture devices, resolution is not the spatial sampling rate, which is characterized by the number of dots per inch (dpi).
The type of measurement described above is considered a threshold metric, because it characterizes the limiting spatial detail that is just resolvable. It reveals nothing about how the lower spatial frequencies are handled in the capture process; in other words, the extent to which they are resolvable. It is largely a pass/fail criterion. Because of this shortcoming, as well as feature, contrast, and inspector dependencies, resolution measurement done in this way is not robust. A supra-threshold metric is needed that removes not only the feature set and contrast dependencies but also the inspector's subjectivity.
The modulation transfer function (MTF) is a metric that allows one to measure resolution in a way that satisfies these criteria. The MTF is a mathematical transformation of the line-spread function (LSF). The LSF is a fundamental physical characterization of how light spreads in the imaging process, and for spatial resolution measurements, it is the Holy Grail. A detailed explanation of MTF, its value, and how it is used can be found in Image Science by J.C. Dainty and R. Shaw (1974).
3.3 Color Reproduction
Color reproduction, like tone reproduction, is a misnomer for scanners because colors are only being captured, not reproduced.
A more accurate term has been coined for the potential color performance or fidelity of a digital capture: the metamerism index. International Standards Organization (ISO) work is under way to propose a metamerism index that would quantify the color-capture
performance of a device relative to that of a human observer. The goal would be for the scanner to 'see' colors in the same
way as humans do. A metamerism index of zero would indicate equivalence between the scanner's color performance and that of
a human observer. Calculation of the metamerism index requires knowledge of the device's color channel sensitivities as well
as the illumination type being used, two pieces of information not normally provided by scanner manufacturers. In the absence
of such a measure, a suitable surrogate for color capture fidelity, called average Delta E*, or  E*, is often used.
E* makes use of a standardized perceptual color space called CIELAB. This color space, characterized by three variables-L*,
a*, and b*-is one in which equal distances in the space represent approximately equal perceptual color differences. L*, a*,
and b* can be measured for any color and specified illuminant. By knowing these values for color patches of a target and comparing
them with their digitized values, a color fidelity index, E*, can be measured.
Finally, gray-scale uniformity may be considered a form of color fidelity. Gray-scale uniformity is a measure of how well neutral tones are detected equivalently by each color channel of a scanner. Although it can also be measured with the CIELAB metric, there are often occasions where the L*a*b* values are not available. In such cases, a first step in measuring color fidelity is to examine how well the average count value of different density neutral patches matches across color channels.
See also, Color Accuracy, Guide 3 and Color Reproduction, Guide 4.
3.4 Noise
For photographic film, noise is often referred to as 'grain' or 'granularity,' since its appearance is granular or random in nature. Like film, digital scanners and cameras have sources of noise related to signal detection and amplification. The nature of this noise is similar to that of film and can be defined as unwanted pixel-to-pixel count fluctuations of a random or near-random nature.
Digital capture devices, unlike film, may also be associated with non-random or fixed-pattern noise sources. For area-array sensors, these include pixel, line, and cluster defects from the detector. For better cameras, these defects are identified at manufacturing and digitally masked in the finished image file. For linear or line-array scanners, poorly corrected sensor defects manifest themselves as streaks in the image. While these are often classified as artifacts, their effects are ultimately integrated into the noise measurement.
Just as a scanner's resolution performance can be characterized via the MTF, noise measurements can be characterized according to spatial frequency content. The term for such a measurement is noise power spectrum (NPS). The photographic community implicitly uses NPS to calculate a singular granularity noise metric by requiring that noise measurements be done under conditions that weight the noise at spatial frequencies consistent with the human visual response (Dainty and Shaw 1974).
See also Noise, Guide 4
3.5 Artifacts
Artifacts are best categorized as a form of noise-correlated noise, to be specific. Because artifacts do not appear as random fluctuations, they do not fit most observers' perceptions of noise and hence are given their own image quality category. Most artifacts are peculiar to digital imaging systems. The most common are nonuniformity, dust and scratches, streaks, color misregistration, aliasing, and contouring/quantization. At low levels, for short periods of viewing, artifacts are considered a nuisance. At moderate levels they can render a digital image defective, especially once the observer has become sensitized to them. The most common types of artifacts may be described as follows:
3.5.1 Nonuniformity
Nonuniformity is a large area of fluctuation in illumination caused by uneven lighting or in-camera light attenuation such as vignetting. Nonuniformity across an image is extremely hard to detect without image processing aids; the illumination can vary as much as 50 percent from center to corner before it can be detected without aids. Flatbed scanners, drum scanners, and film scanners using linear arrays tend not to suffer from nonuniformity problems, in part because their illumination source is often accounted for at scan time. Digital cameras, however, can suffer considerable nonuniformity because of lens performance or improper illumination set-up by the user.
3.5.2 Dust and scratches
While dust is a function of scanner, document, and environment hygiene, the extent to which scratches in film or on a flatbed platen are hidden is often overlooked as a scanner selection criterion. Scratch suppression in film scanners is dependent on proper illumination design. Scratches are increasingly being suppressed after capture through scratch-detection methods and then digitally corrected with interpolation algorithms.
3.5.3 Streaks
Streaks are localized line nonuniformities in a scanned image. Because of the rectangular grid format of digital images, streaks usually occur in horizontal or vertical directions and are often more dominant in scanners using linear-array detectors. Occasionally, repetitive streak patterns, called rastering, can occur across a scanned image.
3.5.4 Color misregistration
Color misregistration is the spatial misalignment of color planes. It can occur because of poor lens performance or the optical-mechanical methods used to capture the image. It is best recognized by color fringing at high-contrast sharp edges and color scans of halftone images. It is most often a problem with inexpensive linear-array scanners. Several years ago, this artifact was not worth considering because it rarely occurred at a significant level. With the advent of less expensive parts and manufacturing shortcuts, however, color registration has become more of a problem and should be monitored.
3.5.5 Aliasing
Aliasing occurs because the sampling rate is insufficient for the spatial frequency content of the object being scanned. It occurs only in digital images. For repetitive features such as halftones or bar patterns it manifests as a moiré pattern. It is also recognized in nonrepetitive features by jagged-edge transitions ('jaggies'). The potential for aliasing can be detected by slanted-edge MTF measurements that are described in Sections 5.3 and 5.5.
3.5.6 Contouring/quantization
Contouring is defined as the assignment of a single digital count value to a range of densities that vary by more than one just-noticeable difference in density. It occurs because of insufficient bit depth in a captured image. It is most noticeable in slowly varying portions of an image and manifests itself as an abrupt and unnatural change in density. Contouring is prevented in most digital capture devices with internal bit depths of 10 bits or greater.
4.0 Understanding Product Specifications
After the requirements for a scanner have been defined, it would seem a simple task to review several manufacturers' product specification sheets and choose the scanner that best meets those criteria. This is certainly true in the case of easily verifiable items, where there is no ambiguity about definition (for example, power requirements, physical dimensions, and sensor type). However, for most criteria related to image quality, this is not the case. Because there are few strict or unique standards for digital capture imaging performance criteria such as resolution, dynamic range, noise, or color fidelity, a manufacturer can choose how it markets a device's capabilities. In the absence of means by which to independently verify specification sheet claims, buyers should remember two rules:
- 1) Approach all imaging performance claims on specification sheets with caution. They are often confusing, inflated, or misleading.
- 2) Generally speaking, you get what you pay for. It is wise to consider a manufacturer's reputation when selecting a scanner, although there are always exceptions.
4.1 Resolution: DPI or Image/File Size?
Specification sheets can offer resolution for digital capture devices in terms of spatial sampling rate or of image or finished file size.
4.1.1 Spatial Sampling Rate
Where document imaging is the presumed application, resolution is in terms of the spatial sampling rate, which may be defined as spatial frequency of pixels on the document. This is the case for flatbed document scanners, drum scanners, copy stand cameras, and microfilm scanners. The rate is cited as dpi, ppi (pixels per inch), or, infrequently, spi (samples per inch). The sampling rate is a necessary, but not sufficient, condition for actual detail capture in sampled imaging systems. Knowing the extent to which light spreads in a capture device by way of the LSF or MTF provides this sufficiency. This is why product specifications for resolution do not enable the user to draw any meaningful conclusions regarding resolution performance. The common terms for sampling rate in specification sheets are optical resolution and addressable resolution.
Occasionally, document scanner resolution is specified differently in the two different directions of the scan; for instance, 600 x 1200 dpi. Although both values are considered optical resolutions, the higher one is usually achieved through a higher sampling rate that outpaces the MTF performance. The lower of these two values, associated with the sensor pixel pitch, is probably a better indicator of true detail capture abilities. Most resolution claims greater than 600 dpi should be viewed with suspicion.
One of the ways of inflating true resolution is the use of interpolated resolution. Interpolation is a powerful and appropriate tool for many image-processing needs, (e.g., isolated defect concealment or benign image scaling); however, using it as a 'pixel-filling' utility to inflate resolution claims is misleading at best. This is because practical interpolation methods are imperfect predictors of missing pixel values. Resolutions of 1800-9600 dpi, sometimes touted by manufacturers, are possible only with the most expensive laboratory equipment or with customized devices such as drum scanners or microdensitometers.
Prudent and successful interpolation methods are found in color filter array (CFA) digital cameras. Unlike the interpolation technique cited above, which fills in pixels where none existed before, CFA interpolation schemes rely on correlated knowledge of the color that actually was sampled at that location. Because resolution between color channels often correlates well, these methods have been shown to be almost lossless for moderate image interpolation.
4.1.2 File/Image Size
For digital cameras having no document reference, resolution is specified in terms of finished file size (e.g., 18 MB), intermediate file size (e.g., 6 MB), or image sensor size (e.g., 2048 lines x 3072 pixels). The path for relating one to another requires knowledge of the number of bits per pixel per color and the total number of colors, as well as some familiarity with the sensor technologies used. This method of resolution specification can be confusing to interpret. The calculation for a finished file is as follows:
| (# lines x # pixels) x (# bits/pixel) x (# colors) x (# bytes/bit) = finished file size |
| (2048 x 3072) x ( 8 ) x (3) x (1/8) = 18,874,368 bytes » 18 MB |
File size determination is an imperfect discipline, largely because of the loose definition that the imaging community applies to the term megabyte. Technically, a megabyte is one million bytes. The imaging community, however, has taken the nearest integer power of two and used this as a basis of calculation. Under this system, a megabyte is (220), or 1,048,576 bytes. Using this number as the divisor in the above equation will yield exactly 18 MB.
Occasionally, cameras with CFA color sensors capture a small intermediate file that is later processed into a larger finished file on a computer. The smaller intermediate file is often specified for purposes of file storage advantages. For example, in the above calculation, there is effectively only one color channel in the intermediate file. Therefore, the intermediate file size is only 6 MB.
Sometimes, very large file sizes are specified that are not consistent with the calculation in the equation just presented. This often occurs when 12 bit/pixel files are created. Since 8-bit (i.e., 1 byte) file storage is standardized, an extra byte is required to store the remaining 4 bits. This leaves four remaining 'empty' bits. Although there are ways to 'pack' these bits efficiently, it is sometimes more convenient not to do so. Therefore, the extra 4 bits/pixel tag along. They have no useful image information associated with them, but they do inflate the finished file size.
As a tattoo for this section, many digital cameras with resolutions lower than 1 Mpixel often cite resolution in terms of equivalent monitor resolution. Common examples are as follows:
| Term used | # pixels x # lines |
| VGA | 640 x 480 |
| SVGA | 800 x 600 |
| XGA | 1024 x 768 |
| SXGA | 1280 x 1024 |
4.2 Bit Depth: Gray Levels, Shades of Gray, Millions of Colors
Specification sheets commonly refer to several different bit depths or to the associated number of gray levels or colors. This can be confusing. The source of this confusion often lies in whether the manufacturer is citing
- the number of bits for one color channel,
- the number of bits for all color channels, or
- the number of internal bits versus the number of finished-file bits.
# gray levels = 2NFor example, an 8 bit per color channel device would potentially yield a maximum of
256 gray levels = 2(8 bits/color channel)The relation between the number of potential colors and the number of bits per channel (N) and number of colors channel (C) is
# of potential colors = 2CxN (e.g., more than 16 million colors = 2 8 bits/ channel x 3 color channelsFor artifact-control purposes, almost all digital capture device manufacturers capture the initial raw data with more internal bits than will be reported to the user in the finished file. This is common engineering practice. As an example, internal captures (that is, A/D conversion) and processing at 10 bits/pixel/color channel are common. It is not until the end of the internal processing chain that the data are converted to 8 bits/pixel channel. For a three-color scanner, this means that 30 bits/pixel (10 bits/pixel x 3 color channels) are maintained initially and finally reported as 24 bits/pixel (8 bits/pixel x 3 colors).
Increasingly, manufacturers are citing internal bits as a means of distinguishing their product without revealing that the bits are inaccessible. This means, for instance, that billions (e.g., 230) of potential colors are claimed for some scanners even though users cannot realize them. This approach holds even for binary scanners (1 bit/pixel). The initial internal capture is done at 8 bits/pixel. This extra bit depth is then used to make intelligent thresholding decisions for optimal binary image quality. This has always been the practice, but only recently has it been cited in specification literature.
4.2.1 Bit Depth Effects on Speed
The greater number of bits accessed brings with it not only the obvious trade-off of increased storage requirements but also the less obvious trade-off of scan time. Some manufacturers that allow access to imagery at various bit depths cite fast scan times associated with the lowest bit depth. Access to higher bit-depth imagery will require longer scan times and will lower productivity.
Bit-depth specifications do not necessarily provide information about the quality of the signal being digitized. Are the bits being used to digitize image data or noise? In all scanners, portions of the bit capacity are used to correct for nonuniformities in the detector. Scanners using inexpensive parts often require a larger portion of the total bit depth for detector compensation. The bits used for this compensation are not usable for image data, but the user has no way to know this.
4.3 Dynamic Range: Maximum Density, # f-stops
Dynamic range is the density range over which a capture device is operational. Two device characteristics, flare light and detector noise, limit dynamic range; however, nearly all scanner manufacturers specify dynamic range as if neither existed in their product. They do so through the following equation, which relates the number of bits per color channel (N) to dynamic range:
Dynamic range (density) = -log 10 [1/(2N-1)]This equation is a theoretical calculation that assumes no practical imaging effects such as flare or imager noise. Table 3 lists dynamic ranges and their corresponding number of bits per finished file according to the equation given above.
| # bits (# f-stops) | 8 | 10 | 11 | 12 |
| Dynamic range | 2.4 | 3.0 | 3.3 | 3.6 |
One should be skeptical whenever these numbers are cited as 'dynamic range values.' They are probably unachievable given that they are based on theoretical calculations. Values slightly removed from these (e.g., 3.1 or 2.8) may be better indicators of performance because of their nonconformity.
Manufacturers sometimes list maximum density values alongside dynamic range specifications (e.g., 'Dynamic Range = 3.0, Maximum Density 3.1'). These maximum density values are biased slightly higher than the stated dynamic range. The manufacturer takes advantage of minimum film and paper base densities and calibrates the scanner so that gray levels are not wasted on densities below them. In this way, the gray levels can be used to encode higher densities. Density biases typically range between 0.10 and 0.30.
4.4 Examples: Interpreting Product Literature
What follows are actual product specifications selected from digital camera or scanner promotional literature. They are used as examples of how to interpret certain vendor claims. The ones cited are common in many performance specifications.
From a digital camera specification:
- 6-million-pixel (2036 x 3060) resolution
- 18-MB image file
- 12 bits/color
From another camera specification:
- 12-bit ADCs for 8+ f-stops of dynamic range
From a 35-mm film scanner:
- 2592 x 3894 pixels (24.3 x 36.5 mm)
The maximum coverage for the document requires that the 8' dimension match the 24.3-mm dimension of the film. The quotient of (2592 / 8') calculates as 305 dpi.
From an inexpensive flatbed desktop scanner:
- 36-bit color quality
- (700 x 1400) dpi and (1400 x 2800) dpi optical resolution with dual-lens design.
- 3.3 dynamic range
The 36-bit color quality indicates that 12 bits/pixel (i.e., 3 colors) are used for data encoding. No clues are given whether this is available in the finished file. However, the 3.3 dynamic range is consistent with 11 bits/pixel, not 12. It is unclear why the lower dynamic range is quoted, although it makes the data more believable. Only testing with gray patch densities can verify this claim.
Reflection densities greater than 2.5 are extremely hard to find. Only for reflection objects with gross ink laydowns, such as silk-screened graphics or ink-jet documents do densities reach these levels.
5.0 Resources and Methods for Image Quality Verification
As pointed out in the previous section, users should generally read manufacturers' product specifications with a high degree of skepticism. Naturally, this leads one to ask, 'What resources and methods are available to measure or monitor image quality features of digital scanners?' This section attempts to answer this question by suggesting target, software, standards, and literary resources to do so. Many tools for monitoring image quality features are incomplete, subjective, or nonexistent. In such cases, suggestions are made on targets that can be captured now and analyzed when the tools become available.
The resources needed to monitor image quality for digital capture devices are no different than those needed for conventional imaging methods, namely, appropriate targets and a means to evaluate the images of those targets. As with all targets, the image characteristics should meet or exceed the particular characteristic being tested. Gray-scale targets for characterizing tone reproduction and dynamic range should be neutral and have a wide density range. Resolution or MTF targets need to contain high amounts of detail. Color-reproduction targets should have a wide gamut of colors. When using targets of any kind to characterize imaging performance, the user should keep in mind that any shortcomings in the target itself will be reflected in the final scanner measurement. To mitigate this, the supplier or user should characterize the target with respect to the image quality feature being measured. To the extent possible, targets should also be consistent with the characteristics of the originals that will be scanned since, for example, the color characteristics of photographic dyes are very different from those of printers' inks.
When capturing target images for image quality analysis, one must document all scanner and driver software conditions. Failing to do so makes the results ambiguous, because the driver software can manipulate data from digital capture devices in nearly infinite ways before it is available for use. (This is another reason to think of a scanner as a 'hardware-driver-application' triad.) The engineering, scientific, and standards communities prefer to have all image quality measurement captures done with all driver settings in null states because the 'raw' nature of the data is fundamental to the imaging process. Typically, these null conditions are as follows:
- gamma = 1.0
- no sharpening
- no compression
- no descreening or blurring
- no automatic scene adjustments
- no tone or color manipulations
The captured digital images of the targets should be evaluated both qualitatively and quantitatively. Qualitative evaluation on a high-quality, calibrated display is especially useful for quickly checking obvious scanning errors and for monitoring image quality features for which quantitative measures are nonexistent or unreliable. Quantitative evaluation is done with software that allows for unhidden, unaltered, and easy access to the data or that has been tested to yield reliable image quality metrics. Few specific or dedicated software tools are currently available to measure many of the image quality features discussed here; however, several are being planned. In the meantime, generalized image tools such as Adobe® Photoshop, NIH Image (http://rsb.info.nih.gov/nih-image/index.html), IP Lab Spectrum (http://scanalytics.com), and Scion Image (http://scioncorp.com) provide a great deal of flexibility for image evaluation, albeit with more tedium.
The following section provides suggestions on the levels of target and software resources to properly evaluate specific features. A good reference for performing either alternate or similar tests of these features can also be found in Desktop Scanners: Image Quality Evaluation (Gann 1999). When performing the evaluations, it is essential to keep track of the software driver settings used.
5.1 Tone Reproduction or Tonal Fidelity
OECF, dynamic range, and flare can all be characterized by capturing and analyzing neutral gray-scale patches that vary from dark to light. The software tools required for each feature are the same; the differences lie in the target format.
5.1.1 OECF
A target for characterizing OECF may be found in a tool that is available at photographic supply stores. It is a simple row or matrix of gray patches like that in a Macbeth® Color Checker, a Kodak® neutral gray-scale, or an IT8 target that tracks the generalized gray level response of a scanner.
By knowing the optical densities of each patch and interrogating the digital file for the average count value associated with it, the user can derive the OECF by plotting the patch density-count value data pairs. To avoid ambiguity, a minimum of 12 patches, spaced nearly equally in density, should be used. Generally, the OECF curve should be smooth, such as that pictured in fig. 2. If not, illumination nonuniformities may be the cause.

5.1.2 Dynamic Range
With a little planning, a similar target can be used to extract dynamic range. Finely incremented gray patches in the high- and low-density portions of the scale need to be included because these extreme densities are responsible for determining the dynamic range. For reflection copy, the densities should range from 0.10 to 2.50. For transmission applications, they should range from Dmin - 3.50. The high-density increments should be about 0.10, while the low-density increments should be about 0.02. Because of the extreme densities, targets of this nature are not readily available commercially and may have to be generated by the user. This can be done for reflection media by obtaining individual neutral Munsell patches or by generating these densities onto photographic paper, ink-jet media, or dye-sublimation media and pasting up one's own matrix of density patches. The densities of the patches must be characterized on a densitometer before being used.
Once the dynamic range target is made, the image is captured, and the data are examined, a plot of patch density-count value data pairs is done as described above. From this plot, one generally finds that no change in count value occurs at the extreme densities, although densities continue to increase or decrease. These are called 'zero-slope' conditions. The difference between the extreme high and low densities where this zero-slope condition occurs is called the 'dynamic range.' A zero-slope condition can be seen at the high-density portion of fig. 2. No further decrease in average count level occurs above a density of 1.35. This is an indication of the effective dynamic range for that scanner at the settings used.
The best way to maintain maximum dynamic range is to have access to the raw internal data at the internal bit-depth level. Whether or not these data are available to the user depends on the vendor. Some vendors supply special firmware that makes the data available. The disadvantage of this proposition is that all processing of the data becomes the responsibility of the user. Nevertheless, its value as an archive file is substantial.
5.1.3 Flare
Flare can be measured with a single gray patch, but it needs to be captured in two image frames. The patch should have a density of about 2.0 and should be no larger than 2 percent of the area covered by the capture device's capture area of interest. One frame is captured with the density patch in a white surround (high-flare) condition, while the other is captured with the density patch in a dark surround (low-flare) condition. The difference in the patches' average count value between the two frames is an indicator of flare. The greater the difference, the greater the flare. Flare limits dynamic range and is typically not a major problem for document scanners that illuminate small portions of the document at one time. For scanners that illuminate the entire document, flare is a potential problem. To the author's knowledge, no suitable targets are commercially available to measure flare.
See also Flare, Guide 4.
5.2 Color Reproduction or Color Fidelity
The best way to measure color fidelity for capture devices is to use a metamerism index. This particular color metric, however, is still under development. The E* metric cited in Section 3 is recommended as a substitute. This requires the capture of a color target with known L*a*b* values, such as an IT8, or Macbeth® Color Checker targets. The methods and tools to evaluate E* are outlined in Desktop Scanner: Image Quality Evaluation (Gann 1999). At a minimum, some sort of gray-scale balance should be ensured by performing channel-specific OECF curves on neutral gray patches and checking for equivalence between each color channel's OECF curve (see fig. 2). The individual color channel OECFs do not align with one another; for the red and blue channels, they cross. In many ways, crossed curves are worse than misaligned curves because the color changes at the crossover point. It is this change in color that is most noticeable upon viewing
The spectral sensitivity of the imaging sensor and the spectral distribution of the illumination source drive color fidelity. These items are available from the manufacturer, but the user needs to ask for them. Once received, they should be recorded as image quality features of essential value for future use. Alternately, the vendor may have International Color Consortium (ICC) color profiles available. These profiles ease the job of color reproduction for any type of supported output device or display.
5.3 Resolution or Modulation Transfer Function (MTF)
There are several techniques and associated targets for measuring MTF. Only the two supported through publicly available software are considered here. The first is the sine wave technique. Sine wave targets of varying spatial frequencies and formats on both reflection and transmission media can be purchased through Sine Patterns (http://www.scioncorp.com). The software and documentation for analyzing the images of these targets can be found on the Web site of the Mitre Corporation (http://www.mitre.org).
The second technique that is an accepted standard ISO 12233 (Photography-Electronic still picture cameras-resolution measurement) for measuring electronic camera MTFs is the slanted-edge technique. Documentation on its benchmark testing has been published (Williams 1998). Targets for applying this technique can also be purchased through Sine Patterns. Analysis software in the form of an Adobe® Photoshop plug-in or Matlab® code can be found at the Photographic and Imaging Manufacturers' Web site (http://www.pima.net). A tutorial document on the utility and purpose of MTFs can be found in RLG Diginews, Volume 2, Issue 1 (What is MTF....and Why Should You Care?).
5.4 Noise
Measuring noise can be as simple as capturing a single digital image of a grayscale step tablet and calculating the standard deviation of the pixel count values contained within each gray patch. A plot of pixel standard deviation (Y-axis) versus mean count value (X-axis) within that patch, similar to the plot in fig. 3, is a good starting point.
Listed here are typical image-processing and application operations associated with scanner drivers and their tendency either
to increase or decrease the measured noise. While these are general trends, exceptions do apply. For example:
| Increases measured noise | Decreases measured noise |
| Sharpening | Descreening |
| Aggressive color management | Median or low-pass filtering |
| Elevated temperatures | Contrast or gamma decrease |
| Contrast or gamma increase | Despeckling |
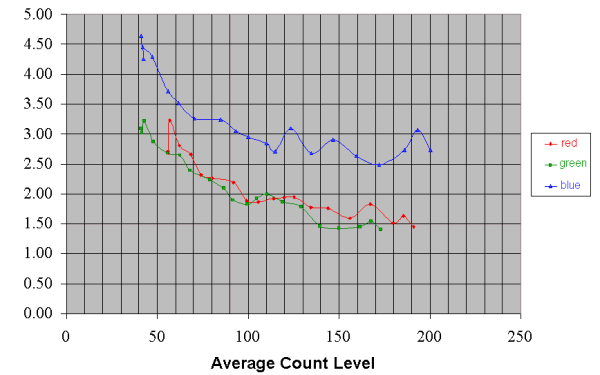
Any target nonuniformities or textures will inflate the measured noise. This is true for document scanners, which are likely to resolve these textures and, to a lesser extent, for digital cameras, which are less likely to resolve them. This can be considered fixed pattern noise associated with the target and should not be assessed to the scanner. Specific ways to separate noise sources are outlined in proposed ISO noise measurement standards (ISO 15739) for digital cameras (PIMA/IT10). The principles can also be applied to any digital capture device.
5.5 Artifacts
The targets used for identifying scanner artifacts are rather simple. They are usually uniform gray patches of varying densities that cover the entire scan area or repetitive feature patterns found on various resolution charts or halftone patterns. To date, qualitative analysis by a trained observer using a good display, along with flexible software having features such as zoom, threshold, histogram, false-color, and movie options, is a suitable methodology for detecting artifacts. Though quantitative values can be placed on these artifacts, robust software with which to do so is unavailable. Perhaps more than anything, the lack of artifacts and the ability to handle those that do exist distinguish good scanners from excellent ones.
Illumination nonuniformity and sensor defects can be detected by examining a capture of a uniform gray patch that spans the entire scan area. Histograms allow one to analyze the data objectively. The wider the histogram, the greater the nonuniformity. Threshold or false-color tools give one a visualization of the rate of nonuniformity or the emergence of defects. Grayscale ramps or wedges are extremely useful for identifying streaking or contouring artifacts in conjunction with the threshold function, contrast adjustment and false-color tools.
While analytical color misregistration tools are available, a visual assessment of misregistration at vertical and horizontal edge transitions can be made by flickering between color channels with movie modes or toggle switches (PIMA/IT10). By noticing how much edges move as the channels are changed, a quick assessment of color misregistration can be made. Misregistration should be measured at several sample rates.
Aliasing, which manifests itself as moiré patterns in repetitive image features can be detected by scanning these features and noting the observability of the moiré. The user must ensure that the resulting image is displayed on the monitor at 100 percent or greater enlargement. Evaluations at other enlargement positions will lead to false impressions of moiré because of the display, not the scanner. The potential for aliasing can also be determined analytically through use of the MTF. Any significant MTF response beyond one-half the sampling frequency should be considered a potentially aliased condition.
5.6 Relative Importance of Image Quality Features for Different Document Types
A document's content will largely determine the relative importance of image quality performance for any particular capture device. For instance, documents containing only bitonal black-and-white information require a low level of grayscale or color registration performance from a scanner. Table 4 rates the relative importance of different document types relative to the image quality features discussed earlier in this section. It is meant only as a guide. Individual situations and environments may require some tuning of these ratings.
| Color trans- parencies |
Line art |
Half- tones |
B&W photos |
Text | Color photos |
Glass plates |
|
| Resolution | 4 | 5 | 5 | 3 | 3 | 3 | 5 |
| Dynamic range | 5 | 3 | 2 | 4 | 2 | 5 | 5 |
| Gray-scale balance | 3 | 2 | 1 | 5 | 2 | 3 | 4 |
| Flare | 4 | 1 | 1 | 4 | 1 | 4 | 5 |
| Color fidelity | 5 | 2 | 1 | 1 | 1 | 5 | - |
| Noise | 3 | 1 | 1 | 2 | 1 | 3 | 3 |
| Aliasing | 2 | 5 | 5 | 3 | 4 | 2 | 2 |
| Color registration | 3 | 4 | 2 | 1 | 4 | 3 | 3 |
| Illumination uniformity | 3 | 2 | 2 | 1 | 2 | 3 | 4 |
| Scratches/dust | 5 | 2 | 1 | 4 | 1 | 4 | 5 |
*Rated on a scale of 1 to 5, where 5 is 'very important,' 3 is 'moderately important,' and 1 is 'not important.'
6.0 Scanner Review
There are five types of digital capture devices from which to choose: flatbed scanners, sheet-fed scanners, drum scanners, cameras, and film scanners. Each has been mentioned in this guide. This section is meant as a review of pros and cons of each device with respect to image quality as well as practical issues such as productivity, cost, and skill level.
| Scanner type | Pros | Cons |
| Flatbed scanner | - Highly addressable - Inexpensive - Many units can handle both transmission and reflection materials - Flexible software drivers - Most good up to 600 dpi of real resolution. - Low learning curve |
- Low productivity, frequent document handling - Tendency toward streaking and color misregistration - Prone to inflated marketing claims |
| Sheet-fed scanner - High productivity - As good as or better than flatbed scanners - Many automatic features |
- Unsuitable for fragile, bound, wrinkled, 3-D, or inflexible objects - More expensive than flatbed scanners - May not handle all sizes of documents |
|
| Drum scanner | - Very high image quality - high resolution - low noise - high dynamic range - good tone/color fidelity - few artifacts - Very flexible software drivers - Variable sampling rate |
- Expensive - Low productivity - Frequent handling - High operator skill level - Handles limited document types; must be mountable on drum |
| Camera | - Can handle a variety of document/ object types (3-D, bound, glass plates, non-flat, oversized) - Unlimited field size - User-controlled lighting. - Rapid capture for area arrays - Non-contact capture - May have interchangeable lenses - Generally good image quality |
- Good models expensive. - Limited sensor size - Low productivity for linear array types - Nonuniformity artifacts common - Area array devices prone to low dynamic range due to flare - Moderate skill level required |
| Film scanner | - Highly productive for roll film - Low flare/ good dynamic range for linear arrays |
- Low productivity for sheet film or slides - Potential for high flare in area-array devices - Dust/scratch artifacts common - Image quality characterization difficult due to lack of targets |
Guides to Quality in Visual Resource Imaging
3. Imaging Systems: the Range of Factors Affecting Image Quality
Donald D'Amato
© 2000 Council on Library and Information Resources
- 1.0 Introduction
- 2.0 Basic Terminology
- 3.0 Components of an Imaging System
- 4.0 Image Quality Specification and Measurement
- 5.0 Color Management and ICC Profiles
- 6.0 Managing an Imaging System
- 7.0 The User's Perspective
- 8.0 Appendix A
1.0 Introduction
Many museums, libraries, and other archiving institutions see digital imaging as a solution to the dilemma of providing unrestricted access to their high-quality document collections while simultaneously preserving those collections within secure, environmentally controlled storage. Digital images may be reproduced indefinitely without degradation and distributed electronically worldwide. Conversion to digital image form may also provide a type of permanence for otherwise deteriorating collections. However, an essential determinant of the value of surrogate digital images, particularly for researchers, historians, and conservators, is their quality.
Speaking of the importance of image quality, Charles S. Rhyne, Professor Emeritus of Art History at Reed College, has stated that 'No potential of digital imagery is more unrecognized and undervalued than fidelity to the appearance of the original works of art, yet none carries more promise for transforming the study of art.' He states further that ' . . . with each jump in quality new uses become possible.' and 'What has been overlooked in most discussions of digital imagery is the immense potential of high quality images' (Rhyne, 1996).
Unfortunately, for many researchers and other users, many of the digital images currently available from museums and libraries could not be termed high quality and are probably suitable only for purposes of document identification.
This guide describes some of the technical issues associated with planning, acquiring, configuring, and operating an imaging system. Final users of the images may also find this guide valuable because it provides suggestions for testing and configuring viewing or printing systems and may help explain decisions made by content originators concerning quality trade-offs.
This guide does not recommend any specific scanner, camera, operating system, or image-processing software, nor does it suggest the use of a specific acquisition technique, sampling frequency, spatial resolution, number of bits per pixel, color space, compression algorithm, or storage format. Rather, the guide provides background information on digital imaging, describes generally applicable techniques for ensuring high-quality imagery, and suggests procedures that, to the maximum extent possible, are not limited by the capabilities of currently available hardware or software. The selection of specific components is left to the system users and should be based upon their assessments of their own image quality requirements, their document sizes and quantities, and the acquisition speed needed.
This guide explains how image quality can be measured and maintained, both during the conversion effort and during subsequent processing. Wherever possible, the various trade-offs that must be made among factors such as image quality, compression ratio, and storage or transmission time are described in terms that are not system-dependent.
The remainder of this section explains the approach to image quality measurement employed by this guide. Section 2 provides some basic terminology. Section 3 describes the main components and processing steps of an imaging system, emphasizing those that are crucial to the maintenance of quality. Section 4 describes how image quality can be specified and measured. Section 5 provides information on the International Color Consortium's approach to color management and the use of ICC profiles. Section 6 discusses some of the issues associated with the management of an imaging system, particularly for the conversion of a large number of objects into digital images. Section 7 describes the end user's perspective on quality management.
1.1 Image Quality Specification and Measurement
When an untrained observer describes the quality of a digital image, he or she generally uses nonquantitative, subjective terms, such as 'lifelike,' 'well-focused,' 'very sharp,' 'nicely toned,' 'good colors,' or 'faithful to the original.' Such terms are, of course, open to misinterpretation. Moreover, the means of presentation and the viewing environment, as well as the content of the images, can greatly affect any visual assessment of image quality, even for a trained observer.
Methods that are more objective have been developed to characterize the performance of an imaging system and the quality of the images it produces. Some of these methods measure image quality using images of actual documents or objects in a collection. As the characteristics of the objects themselves are usually unknown, such approaches depend upon the content of the images and require considerable expertise to interpret. A preferable alternative, and the one employed in this guide, is to measure images of test patterns whose characteristics are known a priori.
The measurement of image quality using known patterns can often be automated or be performed infrequently; it need not be a major effort. Most high-volume conversion projects are readily able to include test patterns within portions of the object images or to capture, occasionally, test pattern images with object images. If test patterns are periodically interspersed and substandard image quality is detected, all images generated after the last above-standard test pattern must be considered substandard. Thus, the frequency with which test patterns are interspersed must be balanced against the cost of rescanning image batches that might have substandard quality.
Standards-making bodies have recently made efforts to develop international standards for the specification and measurement of digital image quality. Notably, the Photographic and Imaging Manufacturers Association Technical Committee on Electronic Still Picture Imaging (IT10) is working to establish standards for electronic still picture imaging. The American National Standards Institute accredits PIMA as a standards-making organization. Among PIMA's activities relevant to image quality is the development of standards for the International Organization for Standardization (ISO) Technical Committee 42, Working Group 18. Table 1 provides the numbers and titles of the ISO/TC42/WG18 image quality standards now being developed, along with their status as of early 2000. Further information may be found at the PIMA Web site's IT10 page.
| ISO Number | Title | Technical Committee | Draft Number |
| ISO 16067 | Photography-Electronic scanners for photographic images-Spatial resolution measurements: Part I Scanners for reflective media | ISO/TC42/WG18 | Working Draft 3.1 |
| ISO 14524/DIS | Photography - Electronic Still Picture Cameras--Methods for measuring opto-electronic conversion functions | ISO/TC42/WG18 | DIS |
| ISO 15739 | Photography-Electronic still picture cameras-Noise measurements | ISO/TC42/WG18 | Working Draft 5.2 |
| ISO 17321 | Graphic Technology and Photography-Colour characterization of digital still cameras using colour targets and spectral illumination | ISO/TC42/WG18 ISO/TC130/WG3 |
Working Draft 3.1 |
| ISO 12233:1999E | Photography-Electronic still picture cameras-Resolution measurements | ISO/TC42/WG18 | FDIS |
1.2 Factors that Affect Quality
The perceived quality of a digital image, and hence its utility for research purposes, depend upon many interrelated factors, including:
- quality of the original objects
- quality of intermediary photographic reproduction, if any
- means of digitization and the conversion parameters selected
- image processing and compression algorithms
- use of reformatting, resampling, or reduction in number of quantization levels
- viewer's hardware and application software
- quality and configuration of the viewer's monitor or printer
- viewing environment
2.0 Some Basic Terminology
Digital images are composed of discrete picture elements, or pixels, that are usually arranged in a rectangular matrix or array. Each pixel represents a sample of the intensity of light reflected or transmitted by a small region of the original object. The location of each pixel is described by a rectangular coordinate system in which the origin is normally chosen as the upper left corner of the array and the pixels are numbered left-to-right and top-to-bottom, with the upper left pixel numbered (0,0).
It is convenient to think of each pixel as being rectangular and as representing an average value of the original object's reflected or transmitted light intensity within that rectangle. In actuality, the sensors in most digital image capture devices do not 'see' small rectangular regions of an object, but rather convert light from overlapping nonrectangular regions to create an output image.
A document or another object is converted into a digital image through a periodic sampling process. The pixel dimensions of the image are its width and height in pixels. The density of the pixels, i.e., the number of pixels per unit length on the document, is the spatial sampling frequency, and it may differ for each axis.
The value of each pixel represents the brightness or color of the original object, and the number of values that a pixel may assume is the number of quantization levels. If the illumination is uniform, the values of the pixels in a gray-scale image correspond to reflectance or transmittance values of the original. The values of the pixels in a color image correspond to the relative values of reflectance or transmittance in differing regions of the spectrum, normally in the red, green, and blue regions. A gray-scale image may be thought of as occupying a single plane, while a color image may be thought of as occupying three or more parallel planes.
A bitonal image is an image with a single bit devoted to each pixel and, therefore, only two levels-black and white. A gray-scale image may be converted to a bitonal image through a thresholding process in which all gray levels at or below a threshold value are converted to 0-black-and all levels above the threshold are converted to 1-white. The threshold value may be chosen to be uniform throughout the image, that is, 'global thresholding' or it may be regionally adapted based on local features, or 'adaptive thresholding.' Although many high-contrast documents may be converted to bitonal image form and remain useful for general reading, most other objects of value to historians and researchers should probably not be. Too much information is lost during thresholding.
These concepts are illustrated in fig.1, which contains a gray-scale image of the printed word 'Gray' and a color image of the printed word 'Color.' A portion of the gray-scale image has been enlarged to display the individual pixels. A bitonal image has been created from the enlarged section to illustrate the consequent loss of information caused by thresholding. As may be observed, the darker 'r' remains recognizable, but the lighter 'a' is rendered poorly. The color image is also displayed as three gray-scale images in its red, green, and blue planes. Note that the pixels corresponding to the color red are lighter in the red plane image and similarly for the green and blue plane images.
Figure 1. A gray-scale image with a portion enlarged, a bitonal image of the same portion, and a color image with its three color planes shown separately.
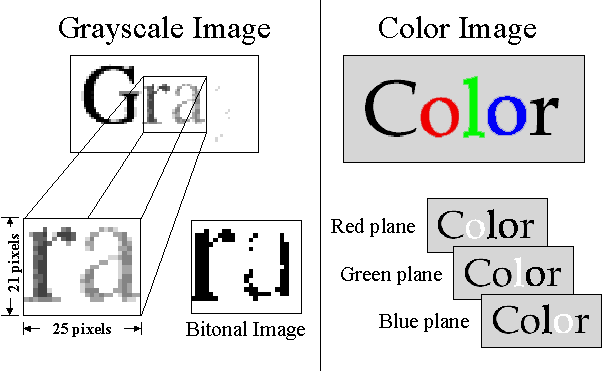
3.0 Components of an Imaging System
The components of a digital imaging system may be either separate devices or processing steps within a computer system. They are discussed in their conventional order of use and include the following:
- Acquisition Image processing
- Compression
- File formatting and storage
- Display
- Printing
3.1 Acquisition-Image Capture Devices
Digital image capture devices may be categorized as scanners or cameras, depending upon how the periodic sampling process is performed. Although there is not a one-to-one correspondence between sensor design and types of capture devices, a scanner usually employs a line-array sensor and captures a single line of pixels at a time. Therefore, the document must be moved across the object plane or the sensor must be moved across the image plane. A digital camera, on the other hand, typically uses an area-array sensor, which captures the values of all pixels within the image during a single exposure. Also, a scanner usually has a fixed object-to-sensor distance, while a digital camera provides a focusing mechanism to accommodate a large range of object-to-sensor distances.
The selection of either a scanner or digital camera for a digital conversion effort involves trade-offs among several factors, many of which are changing rapidly as the relevant technologies, particularly for cameras, evolve. Guide 2 in this series, Selecting a Scanner, provides further information on these trade-offs.
3.2 Image Processing
The term image processing refers to the many digital techniques available for altering the appearance of an image. Image processing operations may be used to enhance original 'master' images, to convert master images to derivative images (reproductions of reduced quality), or to prepare master or derivative images for display or printing. Image processing operations include the following:
- resampling-changing the image's pixel dimensions
- pixel level modification
- adjustment of brightness and contrast
- gamma correction
- histogram modification
- color correction
- enhancement through sharpening, smoothing, or spatial filtering
- thresholding-converting a gray-scale or color image to a bitonal image
- rotation-either by multiples of 90 degrees or through an arbitrary angle
Because this guide is not intended to include an extensive discussion of image processing, only resampling and enhancement will be discussed here. These two techniques were chosen because they are often used in high-quality imaging. Resampling alters the sampling frequency and, hence, the pixel dimensions of an image, for purposes such as down-sampling for more efficient display, printing, or transmission. The image enhancement technique of 'unsharp masking' is used to compensate for image blurring or smoothing that may occur as a consequence of scanning or printing. The interested reader is referred to the many textbooks available on image processing for further descriptions of these and other image-processing techniques.
3.2.1 Image Resampling
The conversion of a digital image having a particular number of pixels in each axis into another image with a different number of pixels in each axis may be done through a resampling process. Resampling should be distinguished from resizing, in which the number of pixels in each axis remains the same but the stored values (usually in the image file header) representing the number of samples per unit distance along each axis are changed.
Resampling is most often associated with the process of creating derivative images from a master digital image. However, scanning systems themselves often perform resampling to convert from their actual ('true optical') sampling frequency to a selected output sampling frequency. The algorithm selected for such processing can have significant consequences on the quality of the output images. Indeed, resampling to create images of a higher sampling frequency than the optical sampling frequency (a process often referred to as interpolated resolution) should be avoided since it only increases the size and processing times of the image but does not enhance its quality.
The three most commonly used algorithms for resampling involve assigning values to the pixels in the new (resampled) image based upon
- the value of the closest pixel among the four surrounding pixels in the original image ('nearest neighbor')
- a weighted combination of the values of the four surrounding pixels in the original image (bilinear interpolation)
- a weighted combination of the values of the sixteen surrounding pixels in the original image (bicubic interpolation).
The nearest neighbor approach provides the fastest processing but results in the poorest quality. Bicubic interpolation usually provides the best quality but requires considerably more processing time, especially for larger images. Bilinear interpolation is intermediate in quality and processing speed.
Although bilinear interpolation is generally standardized, the algorithm and the parameters used for bicubic interpolation are implementation-dependent. Results of varying quality are observed among commercially available image-processing systems.
See also, Guide 2, Spatial Sampling Rate.
3.2.2 Unsharp Masking
A commonly used image enhancement technique for sharpening an image is known, somewhat enigmatically, as unsharp masking, derived from conventional film photography. The term refers to the sequence of operations in which a purposely blurred (unsharpened) negative copy of a photograph is used as a subtractive mask, in combination with the photograph itself, to produce a sharpened copy of the photograph.
In the digital domain, unsharp masking is performed by generating a smoothed copy of an image, multiplying the smoothed image by a fractional value, and subtracting it from the original image. All three operations can be performed in a single spatial filtering operation. Digital unsharp masking can be very effective at reducing the inevitable image degradation in scanners that results from document motion during exposure, charge spreading in the sensor, and poor focus and in printers from ink or toner spreading.
The selection of the parameters to be used for the unsharp masking of images before display or printing is, unfortunately, largely a trial-and-error process, and each image-processing package provides a slightly different set of parameters for the user to adjust. Nonetheless, when a set of parameters has been found that enhances the images without introducing excessive noise, those parameters can be used for similarly captured and printed images.
3.3 Compression
Because images may consume large amounts of storage, various types of compression algorithms are used to reduce their size. Most images compress quite well because the values of the pixels of an image are usually locally correlated. Compression algorithms use this correlation to reduce the number of bits that must be stored or transmitted.
Image-compression algorithms may be either information-preserving (also known as reversible or lossless) or non-information-preserving (also known as irreversible or lossy). Lossless compression can be reversed to generate the original image exactly; lossy compression sacrifices information and cannot be reversed without some degradation. For most images, lossy compression achieves substantially higher compression ratios than does lossless compression, often without sacrificing much in fidelity to the original.
Guide 5 in this series, File Formats for Digital Masters, covers compression more extensively.
3.4 File Formatting and Storage
An image file format should be flexible, powerful, able to accommodate a wide range of image formats and compression techniques, nonproprietary, and officially published by an international standards-making organization. In addition, it should be widely supported by computer software applications.
If a company-developed product or specification becomes widely used, it is a de facto standard, and other vendors may support it to stay competitive. In the imaging field, there are many de facto standards. The disadvantage with any de facto standard is that the authoring organization can modify it at will, without consulting the user community. Guide 5, File Formats for Digital Masters, covers file formats more extensively.
3.5 Displays
Currently, two technologies dominate the display of color images-shadow-mask cathode ray tubes (CRTs) and liquid crystal displays (LCDs). The quality of the displayed images depends not only on the monitor's capabilities but also on the computer's display adapter board (i.e., the graphics card or video display adapter) and its setup, the configuration of the display driver software, appropriate characterization of the monitor, and the viewing environment.
3.5.1 CRT Displays
CRT displays are the means through which most high quality 'soft copy' images are provided to users. Color CRTs use an array of red-green-blue phosphor triads, combined with a precisely aligned metal shadow mask and electron guns, to produce color images. A diagram of these components and their physical relationships with one another is provided in fig. 2. (Note that the diagram incorrectly implies that the electron beams pass through one hole at a time. In actuality, CRTs have electron beams that at the 5 percent intensity level encompass several holes.)
Even if the CRT's electron beams could be precisely focused, the minimum size of displayed pixels is constrained by the triad spacing, since each pixel should encompass at least one triad. High-quality displays currently available have a triad pitch of about 0.25 mm (0.01'), thereby limiting their useful pixel density to about 100 per inch.
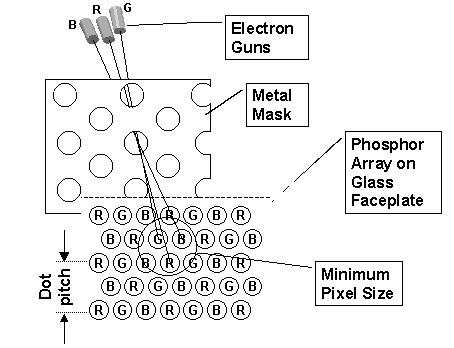
The dynamic range of a CRT is the ratio of its brightest light intensity to its darkest, as measured under ambient lighting. Maximum brightness is limited by the electron beam current, the fraction of the electron beam current that passes through the shadow mask, and the efficiency of the phosphors. The darkest value is limited by the reflection of ambient illumination from the phosphor matrix and the glass faceplate.
3.5.2 Liquid Crystal Displays
LCD technology has improved substantially in recent years, and LCDs now almost compete with CRTs in certain high-end image display applications.
The term liquid crystal refers to a state of a substance that is neither truly solid nor liquid. In 1963, it was discovered that the way in which light passes through a liquid crystal could be affected by an applied electric field. LCDs are formed in a sandwich-like arrangement in which the liquid crystal layer affects the rotation of polarized light. By placing polarizers on the light entering and leaving and transparent electrodes on either side of the liquid crystal layer, it can make light selectively pass through the sandwich, when and where a voltage is applied. Color LCDs are formed using a color filter array for the exiting light.
While LCDs are perfectly flat, dimensionally stable, and require no focusing, they do not yet have the spatial resolution of CRTs. The other challenges facing the designer of color LCDs for imaging applications include obtaining sufficient brightness, contrast, number of levels per color, and range of viewing angles.
3.5.3 Display Adapters
The computer's display adapter converts the digital images stored in the computer to the analog electronic signals required by the monitor. The adapter determines the maximum number of pixels addressable in each axis (addressability), the refresh rate, and the number of colors per pixel. (Of course, the monitor must be equally capable. Just because the adapter has addressability does not means that all of the pixels are distinguishable or resolvable on the monitor.)
Display adapters usually contain their own memory to store the images during refresh cycles. As an example of memory requirements for a display adapter, the display of 1,280 (horizontal) pixels by 1,024 (vertical) pixels with 24 bits of color information per pixel requires at least 4 megabytes of video memory (i.e., 1,280 x 1,024 x 24 / 8).
3.5.4 Display Characterization
The colors produced by a CRT display are dependent not only upon the amplitude of the input signals provided by the display adapter but also upon the phosphors and electron gun currents and voltages (which are affected by the display's brightness, contrast, and color temperature controls) and by the ambient illumination. For the same input signal, displays from different manufacturers or with differing model numbers can produce quite different colors. Moreover, as monitors age, their electron guns produce less current and the conversion efficiency of their phosphors may diminish. The consistent display of colors requires, therefore, that a display device be characterized periodically to reassess its behavior for various input values.
Characterization is the process of determining the way in which a device renders known colors. It should be distinguished from calibration, which is the process of making sure that a device is performing according to a priori specifications that are usually provided by the manufacturer. A display may be characterized by measuring its output colors using a colorimeter or spectrophotometer for a various digital input values. Characterization detects a device's color space and gamut (i.e., its range of displayable colors.) Alternatively, a display may be characterized more coarsely through an interactive manual process in which displayed colors are compared with one another and with the colors on a printed sheet of paper.
The characterization of a device and the development of a computer file, or profile, that contains a precise description of the device's responses to known colors is often termed profiling. Section 5 of this guide provides further information on the profiling process.
3.5.5 The Viewing Environment
The viewing environment can have a surprisingly large effect on perceived colors. For high-quality imaging, it is essential that a consistent viewing environment be maintained. Ambient illumination can affect the colors from a display because a portion of incident light is reflected from the surface of the CRT and from its phosphor matrix. Our perception of color is also affected by the colors of materials surrounding the display. It can be very challenging to compare the colors from a self-luminous device, such as a CRT, with those from a reflective surface, such as a painting. Viewing environments having standardized illumination and neutral surroundings are essential for such comparisons.
3.6 Printing
Unlike self-luminous displays that render colors through an additive process, the printing of color uses a subtractive mixture of dyes or pigments. The three subtractive primaries-cyan, magenta, and yellow-are commonly used. However, if these primaries were present in equal quantities, only eight colors could be produced. To extend the range of printable shades requires that the printing system modulate the amount of ink deposited. Printing systems can be categorized into two types: (1) those that are able to control either the density of ink deposited at each ink dot; and (2) those that can produce ink dots only of a consistent size and density but that can change the frequency of occurrence of the dots. The first category can be termed continuous-tone printers, the second halftoning printers.
The determination of whether to use a continuous tone or a halftoning printer for an application is not as obvious as it once may have been. Commercially available printers in both categories have improved substantially. Notably, for many applications ink-jet printers, which use sophisticated halftoning methods, now compete with dye-sublimation and photographic printers, which use continuous-tone methods.
3.6.1 Continuous-Tone Printers
Continuous-tone printers are able to control the density of ink or the resulting dot size through a modulation of the mechanism for ink deposition. For example, in dye-sublimation printers, the temperature of each of the pixel-sized elements in a heating element array controls the amount of dye transferred from a donor film to the paper. When the donor film is changed and the paper repositioned, successive deposition of cyan, magenta, and yellow dyes produces a full-color print. Precise color rendition requires that the temperature of each of the elements be carefully controlled.
3.6.2 Halftoning Printers
Conventional halftone printing uses a photographic screen with holes that have a radially varying density. A print is created when a conventional photographic negative is masked with the screen during the printing of a high-contrast positive. The resulting image contains the pattern of the screen with the size of each of the dots varying in proportion to the amount of light transmitted by the negative. The halftoned print may then be used to create a printing plate.
In digital halftoning, the dot size remains constant while the frequency of occurrence of the dots is varied within many small halftone cells. Fig. 3 displays a simple halftoning scheme with halftone cells consisting of 3 x 3 dots, thereby providing 10 levels of density per cell. In this case, each pixel is represented by one halftone cell. Commercial devices use considerably more sophisticated algorithms to ensure that their dot patterns are not prominent and that the transitions between regions with differing levels are not obvious.
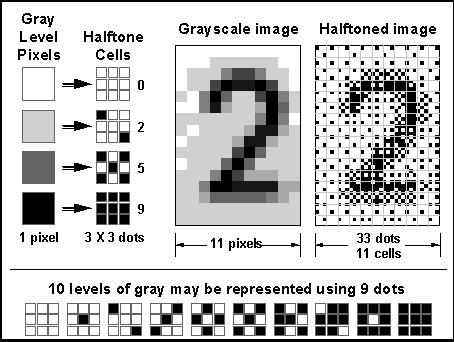
3.6.3 Confusing Terminology: ppi, dpi, lpi
There is considerable confusion in the field of digital imaging about terms relating to halftone screen frequency, printable dot frequency, and spatial sampling frequency. Too often, the term dots per inch (dpi) is used in lieu of pixels per inch (ppi). The term dpi should probably be reserved for the dot frequency in a halftoning printer, while the term ppi should be used when referring to the sampling frequency of a scanner or camera. A less frequently used term is lines per inch (lpi), which should be used when referring to the line or halftone cell frequency of a halftoning printer or to the frequency of occurrence of lines in a bar pattern.
3.6.4 Printer Characterization
A continuous tone or halftoning printer may be characterized, or profiled, by printing a digital test pattern containing a series of known color patches. The colors of the patches on the output print are measured using a colorimeter or spectrophotometer. Profile-building software, which reads each of the patches and compares their colors with those expected, is used to build the profile that describes the printer's characteristics precisely.
4.0 Image Quality Specification and Measurement
The design of an imaging system should begin with an analysis of the physical characteristics of the originals and the means through which the images may be generated. For example, one might examine a representative sample of the originals and determine the level of detail that must be preserved, the depth of field that must be captured, whether they can be placed on a glass platen or require a custom book-edge scanner, whether they can tolerate exposure to high light intensity, and whether specular reflections must be captured or minimized. A detailed examination of some of the originals, perhaps with a magnifier or microscope, may be necessary to determine the level of detail within the original that might be meaningful for a researcher or scholar. For example, in drawings or paintings it may be important to preserve stippling or other techniques characteristic of the artist.
The analysis should also include an assessment of the quality required by the applications for which the images will be used. The result of that assessment will guide the selection of the algorithms and components used in the scanning, compression, storage, display, and printing subsystems. Judgments of quality can be very subjective. Inevitably, trade-offs must be made among many parameters and costs of the various components.
While there does not seem to be any single, content-independent metric that relates closely to our perception of quality, there are many metrics that, in combination, can be used to specify a desired level of image quality, at least if images of test targets may be captured and analyzed. Thus, if the original documents or objects to be digitized are first characterized through measurements of the range of their reflectances, colors, and levels of detail, it is then possible to select image quality test targets and testing procedures to ensure that these characteristics are faithfully captured in the images.
There is considerable confusion in the field of digital imaging, perhaps caused by commercial competition, about the specification of image quality. For example, scanner manufacturers often emphasize the 'true optical resolution' of their systems when referring to the maximum number of pixels that can be acquired (without interpolation) per unit length along each axis. This number is usually expressed in dpi or ppi. Scanner manufacturers also often emphasize 'bit-depth,' which is the number of bits per pixel (bpp) that their systems are capable of capturing. However, most buyers do not realize that scanners having identical 'true optical resolution' and 'bit-depth' may capture images of quite different quality. As another example, digital camera manufacturers often describe the 'resolution' of their devices in terms of the total number of pixels in the image sensor. Again, the quality of the images produced by digital cameras having equal numbers of total pixels can vary substantially, even if the number of color levels produced are identical.
The following subsections define many of the terms associated with image quality and describe how quality can be specified and measured using test patterns and associated metrics.
4.1 Spatial Sampling Frequency and Geometric Distortion
The spatial sampling frequency, or sampling rate, is the number of pixels captured per unit length, measured in the plane of the document or other object. Manufacturers often refer (incorrectly) to a scanner's maximum spatial sampling frequency as its 'true optical resolution.' Sampling frequency can be easily and precisely measured with a test pattern containing horizontal and vertical rulings. For a flat field of view, the sampling frequency should be uniform throughout. Any variation in the sampling frequency would result in geometric distortion.
Other factors being equal, the storage required for an uncompressed image is proportional to the product of the sampling frequencies for each axis. There is, therefore, considerable motivation to use the minimum sampling frequency that will produce images with a level of quality appropriate for the applications in mind.
4.2 Quantization and Tonal Response
The storage required for an uncompressed image is proportional to the logarithm of the number of quantization levels. A gray-scale image using 256 (i.e., 28) levels per pixel would require one-half of the storage required for the same image if 65,536 (i.e., 216) levels per pixel were used. The number of levels of quantization per pixel is usually chosen to be the maximum number of values that can be represented by integer multiples of a byte.
Although the human eye does not have a linear response to light intensity and most computer displays do not produce light with an intensity that is linear with input, the quantization levels of input devices are most often chosen to be spaced uniformly with respect to input light amplitude. That is, the tonal response is selected to be linear with reflectance or transmittance.
Measurement of the values from gray-scale step patterns (often called step wedges) enables the determination of the tonal response curves of a scanner or camera. Fig. 4 displays a 20-step gray-scale wedge pattern and the values of optical density for each step.
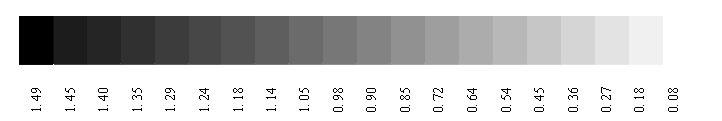
The optical density of a reflective medium is usually provided relative to that of a perfect diffuse reflector. (A perfect diffusely reflecting surface is defined to have an optical density of zero.) Absolute reflectance is equal to the number 10 raised to the negative of the optical density
and is usually expressed as a percentage. (A perfect diffusely reflecting surface would have an absolute reflectance of 100 percent.) The relative reflectance of one of the steps in the pattern (relative to that of the paper itself) may be found by subtracting the optical density of the paper from the optical density of the step and raising the number 10 to the negative of that value

The measurement of the color response curves for a low-cost color scanner is illustrated in fig. 5. As may be seen, the response curves for this particular unit are quite nonlinear, with a definite convex upward shape. This is often referred to as having a gamma, or exponent, of less than one. Note that the straight black line is the least squares fit to the red response. The linear equation and the correlation coefficient for this fit are also shown.

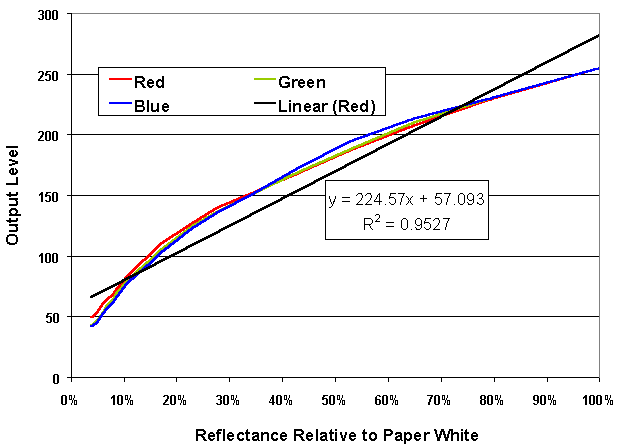
4.3 Spatial Resolution
Spatial resolution is a measure of the ability to discern fine detail in an image. An image with high resolution will appear to be sharp and in focus. Although the spatial resolution of a scanning system is often considered equivalent to its sampling frequency, it is a distinct metric and should be measured with a suitable test pattern.
Scanning systems having the same sampling frequency and quantization can exhibit quite different spatial resolutions, depending upon focus accuracy, contamination of the sensor or optical elements, vibration in the document transport mechanism, electronic noise introduced before analog to digital conversion, and other factors.
4.3.1 Visual Assessment of Spatial Resolution
For many systems, spatial resolution can be judged visually using simple legibility patterns such as those shown in fig. 6.
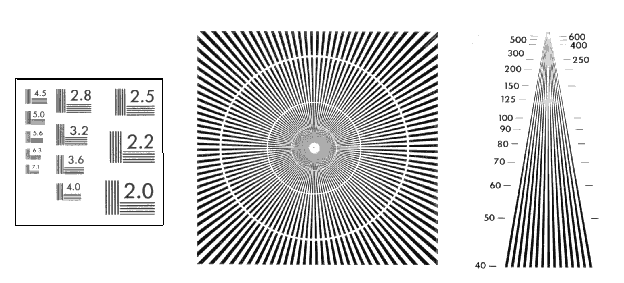
In these test patterns, either a series of parallel black-white line pairs of decreasing spacing (and, hence, increasing spatial frequency) or of converging black-white lines is printed. The numbers printed next to the various pattern elements are the spatial frequencies, expressed in line pairs per millimeter or per inch. The star pattern's circular breaks are at spatial frequencies of 50, 100, and 200 line pairs per inch. Using these test patterns, one can make a rough assessment of spatial resolution by determining that point at which the black lines appear to merge or become virtually indistinguishable from one another.
Several cautionary statements must be issued concerning the use of such patterns. First, it is easy to misinterpret the resulting images because of a phenomenon known as aliasing, in which misleading patterns are caused by the interference of the sampling grid and the pattern. Second, the shape of the tonal response function affects the appearance of the bar patterns. Specifically, high contrast will cause the black-and-white bar pairs to appear to be sharper than they really are and the image to appear to have a higher resolution. Before attempting a visual comparison between two systems, one should ensure that they have the same tonal range and response function. A third caution is that bar patterns whose frequencies are above the Nyquist limit, i.e., one-half of the sampling frequency, should not be used.
4.3.2 Techniques for the Measurement of Spatial Resolution
One metric of spatial resolution is the spatial frequency response, also known as the modulation transfer function (MTF). MTF is the amplitude of a linear system's output in response to a sinusoidally varying input signal of unit amplitude. Equivalently, it is the magnitude of the Fourier transform of a system's response to an input signal that is a perfectly sharp, single point of light-the point-spread function of the system.
The MTF describes the response of a linear system to all frequencies (up to the Nyquist limit of one-half the sampling frequency). It can be measured directly, using sine wave modulated patterns, or with a step function image (i.e., a 'knife edge' transition), through the Fourier transform of the difference function.
Because MTF is a function of spatial frequency, attempts have been made to reduce MTF curves to a single number, such as the modulation transfer function area (MTFA), which is the area under the MTF curve, compensated for the characteristics of the human visual system.
An alternative metric of resolution, and one that is usually simpler to measure because it requires only direct measurement with a high-contrast bar chart, is the contrast transfer function (CTF). The CTF is deemed more susceptible to aliasing errors and other misinterpretations than is the MTF, although methods of detecting such aliasing and determining the MTF by using the CTF have been developed.
See also, Guide 2, Resolution or Modulation Transfer Function.
4.4 Spatial and Temporal Uniformity
Ideally, the response of an image acquisition system to an object having uniform reflectance will be uniform throughout the system's field of view (spatially) and over time (temporally). However, the response of a real imaging system varies over its field of view because of uneven illumination, optical aberrations, and nonuniform levels among the image sensor's elements for the same input light intensity. A system's response may vary over time because of varying illumination levels, electronic noise during digitization, or statistical variations in the numbers of charge carriers (electrons or holes) collected.
Spatial and temporal uniformity may be measured using test patterns of uniform reflectance. Suitable averaging over multiple images can separate the temporally and spatially varying components.
A useful technique to assess the response and illumination variability over the field of view is to acquire an image of a uniform target and to perform histogram equalization on the image. In histogram equalization, the original image's pixel levels are redistributed to achieve a uniform distribution in the output image. The histogram of an image is a graph of the frequency of occurrence of its pixel levels. Spatial variations that are not apparent in the original image often become apparent in the histogram-equalized image. This technique is illustrated in fig. 7. In this case, although the unequalized image appears uniform, unevenness in the illumination is quite apparent in the histogram-equalized image. The top is noticeably darker, there is evidence of smudges or fingerprints on the glass, and there may be a slight darkening of several columns of pixels (i.e., in the slow scan direction) on the right side.
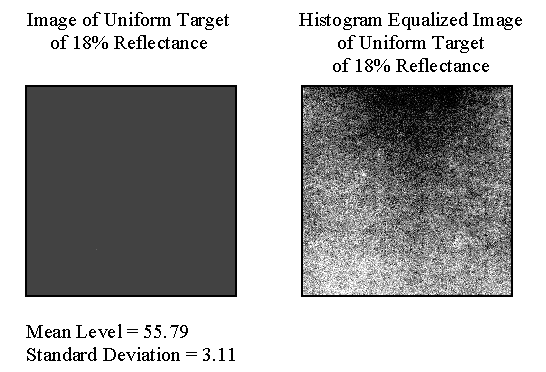
4.5 Color Accuracy
Humans perceive color when combinations of wavelengths of visible light strike the retina of their eyes. Many people do not realize, however, that differing combinations of wavelengths can produce the same color sensation.
There are three types of color receptor in the human eye; consequently, we can describe the sensation of color by three values. A color model enables a unique code or set of coordinates, usually three, to be assigned to each perceivable color. We can imagine that each of these coordinates is an axis in a three-dimensional space, and that the range of all perceivable colors fills this space. For example, we can envision a red, green, and blue (RGB) space, such as is used by television displays, to be a cube with sides of unit length, with the origin (0,0,0) representing black and the opposite vertex (1,1,1) representing white.
Displays that produce color by the emission of light are based upon an additive color model, usually with red, green, and blue primaries, although the actual combinations of wavelengths emitted by the RGB primaries are system-dependent. Systems that produce color through the absorption of light (e.g., printing pigments) are based upon a subtractive color model, usually including black and the three colors cyan, magenta, and yellow (CMYK). Again, the particular combinations of wavelengths absorbed are system-dependent.
Color for both emissive and absorptive systems can be measured using a device known as a colorimeter, which mimics the human color response. A colorimeter is a spectrophotometer (a device that measures light intensity as a function of wavelength) with spectral weighting functions that simulate the sensitivity of the eye's color receptors.
4.5.1 Device-Dependent Color
The commonly used additive color RGB coordinate systems of monitors and scanners are device-dependent; that is, the color produced or sensed by a particular combination of RGB coordinates will vary from one system to another. Additive RGB systems cannot encompass all perceivable colors. Similarly, subtractive CMYK coordinate systems, such as used in most color printing devices, are device-dependent and can render only a limited range of colors. The range of colors that a device is capable of rendering is known as its gamut.
4.5.2 Device-Independent Color
In 1931, the Commission Internationale de l'éclairage (CIE), or International Commission on Illumination, produced a standard response function (known as the Standard Observer) for color matching based on experimentation with normal subjects viewing colored light sources under carefully controlled conditions. The CIE developed an artificial coordinate system in which the tristimulus values required to match all perceivable colors are made positive, and designated these coordinates X, Y, and Z, which are often normalized to x, y, and z.
|
|
|
|


Since then, there have been refinements to the Standard Observer, although the x, y, and z values remain the basis for many device-independent representations of color.
Fig. 8 displays three curves in 1931 CIE xy space. (The third dimension, z, may be omitted because x + y + z = 1.) Such a plot is known as a chromaticity diagram. Any color, without its luminance component, is represented by a point in this space.
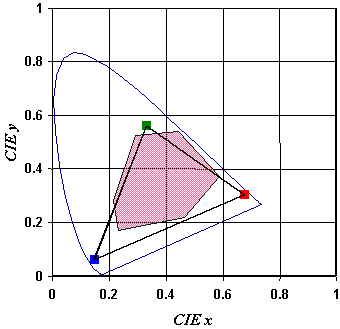
The outermost curve in this plot is the locus of all monochromatic wavelengths of visible light (known as the CIE Standard Observer Curve); all perceivable colors lie within it.
The vertices of the triangle represent the coordinates of the primary colors of an additive color device, specifically the colors of the three phosphors of an RGB monitor. The region within the triangle represents the monitor's gamut (i.e., the range of all possible colors that may be displayed by the monitor.) Clearly, many perceivable colors are outside of the triangle and cannot be rendered by this device.
The irregular hexagon represents the gamut of a subtractive color device, specifically a dye-sublimation printer. All colors printable by this device lie within the hexagon. Again, a large range of perceivable colors cannot be rendered by the device. The area of intersection of the triangle and the hexagon represents the range of colors that are viewable on both the monitor and the printer.
4.5.3 Perceptually Uniform Color Space
While the CIEXYZ color space is device-independent and can represent all perceivable colors, it is highly nonuniform in terms of perceptible color shifts. A slight change in the values in one portion of the space may represent only a slight color shift. That same numerical change in another portion of the space may represent a considerably larger color shift. This is a problematic situation if one desires to specify the tolerances with which colors may be rendered.
A color space has been specified by the CIE that includes all of the physically realizable colors and is close to being perceptually uniform; that is, a just-perceptible variation in color is of approximately the same size throughout the space. Its color coordinates, designated L*, a*, and b*, are described in terms of the CIE X, Y, and Z coordinates. The color space is often termed CIELAB. L is the lightness component, and a (green to magenta) and b (blue to yellow) are the chromatic components. A definition of CIELAB color space is provided in Appendix A.
One measure of color difference in CIELAB, known as Delta E, is the simple Euclidean distance between the colors. A Delta E value of 1.0 is usually considered to represent a just-perceptible change in color.
See also, Guide 2, Color Reproduction.
4.5.4 Surface Texture and Specular Reflection
When we see uniformly colored objects under normal room lighting or daylight conditions, we perceive them to be uniformly illuminated and reflecting a uniform amount of light. In actuality, few objects in our surroundings are either uniformly illuminated or have surfaces that only reflect incoming light diffusely. Most surfaces reflect light both diffusely and specularly. Specular (or mirror-like) reflection occurs on smooth surfaces when the angle of incident illumination is close to the angle of reflection.
Surface characteristics such as texture and gloss produce an appearance that is dependent upon the angle of view. A scanner or camera having uniform illumination and a single point of view cannot capture angle-of-view-dependent features. Thus, if only two-dimensional images are considered, there must necessarily be differences between the original and the reproduction for many artworks, and these differences will probably be difficult to quantify. Some of these differences may be of interest to researchers; for example, an art historian may wish to examine brush strokes on an oil painting. To characterize at least some of the surface effects, it may be possible to examine differences between an image obtained with carefully placed, multiple point sources and an image with uniform illumination.
5.0 Color Management and ICC Profiles
The end-to-end management of color in the printing industry has traditionally been as much art as technology. It has required coordination between the designer and the printer of a color document and a feedback loop that allows a designer to inspect and alter, if necessary, the colors in the final product. Over time, a designer would become more familiar with the characteristics of particular printing systems and learn to alter the colors on his or her display to accommodate those characteristics. As computer networks evolved and the display or printing of a document image became more removed from its production, the need arose for device-independent color management in which colors are specified absolutely.
5.1 International Color Consortium
The ICC was formed to develop a specification for a color profile format. The assumption underlying the specification is that any input or output device could be profiled (characterized) to describe the transformations required to convert any image from a device-independent color space to that of the device itself and from the device's color space to the device-independent space.
The ICC was established for the purpose of 'creating, promoting and encouraging the standardization and evolution of an open, vendor-neutral, cross-platform color management system architecture and components' (ICC 1999). The ICC now consists of a group of more than 50 companies that include both manufacturers and users of color imaging devices.
5.2 Profile Connection Space
The conversion (in both directions) between I input color spaces and O output color spaces would seem to require 2 x I x O different conversion functions. However, by using an intermediary color space, in which all perceivable colors can be represented, only 2 x (I + O) different conversion functions are required-a substantial reduction in the number of functions if conversion among many spaces must be performed. This intermediary space can be thought of as a common language, with interpreters required only to translate the common language to and from the languages of each of the input and output spaces.
Using such an intermediary device-independent color space, known as the profile connection space (PCS), the ICC developed a specification for the unambiguous conversion among the many device-dependent color spaces (ICC 1998). The ICC has chosen two PCSs, namely CIEXYZ and CIELAB.
Fig. 9 illustrates this concept for two input and two output devices. A color management system uses information within the profiles, which contain explicit information on the color response characteristics of each of the devices, to convert between the native color spaces for any combination of the input and output devices.

Although fig. 9 shows input only via direct digitization scanner or camera, it is also applicable for input using an intermediary photographic process. If either photographic prints or transparencies are used before digitization, a profile could be prepared that included such photographic processing. In that case, the color test pattern for the preparation of the profile should be photographed and processed in a manner identical to that used for the objects in the collection.
5.3 ICC Profile Format
Device profiles are explicitly defined data structures that describe the color response functions and other characteristics of an input or output device and provide color management systems with the information required to convert color data between a device's native (i.e., device-dependent) color space and the PCS. The ICC specification divides devices into three broad classifications: input devices, display devices, and output devices. The ICC also defines four additional color processing profile classes: device link, color space conversion, abstract, and named color profiles.
ICC-compliant color profiles are combined ASCII and binary data files that contain a fixed length header, followed by a tag table, followed by a series of tagged elements. The header provides information such as the profile's size, the date and time it was created, the version number, the device's manufacturer and model number, the primary platform on which the profile was created, the profile connection space selected, the input or output data color space, and the rendering intent. The tag table is a table of contents for the tags and the tag element data in the profiles. The tags within the table may be in any order, as may the tagged elements. Both matrix multiplication and look-up table calculation elements may be used for the conversion between native color spaces and the PCS.
Color profiles can exist as separate files and may be invoked as needed by a color management system, in which case they are usually placed within specified system-dependent folders. They can also be embedded within several types of image files, notably in Tag(ged) Image File Format (TIFF), JPEG File Interchange Format (JFIF), and Encapsulated Postscript (EPS). The intention of embedded profiles is to allow a user to display or print a file's color data without having the profile of the system that created the image stored on the destination system.
5.4 Creation and Editing of Device Profiles
Device profiles may be obtained from a device's manufacturer or, with the use of profile-building software, they may be created by the device's user. The profiles from the manufacturer are usually generic for a specific model and do not account for unit-to-unit variability. Precision color management requires that a system's user create a custom profile and check its accuracy periodically, since a system's color response may differ from the manufacturer's nominal response and may change over time as a consequence of lamp aging, amplifier gain change, phosphor aging, and similar factors. Several commercially available software packages enable users to create and edit profiles for scanners, digital cameras, monitors, and printers.
5.4.1 Scanner Profiling
For scanners, the creation of a profile requires that a calibrated color test target be scanned. The test target most often used is the IT8.7, which is available as a reflective 5' x 7' print (IT8.7/2), a 35-mm slide transparency (IT8.7/1), and a 3' x 4' transparency (IT8.7/3). The IT8.7 contains approximately 250 color swatches. Each physical target should be accompanied by the set of its calibrated color values in a computer file known as a target description file. The profile-generation software compares the values specified for each of the swatches with the input values from the scanner to create the scanner's profile. Fig. 10 displays a reduced size image of Kodak's version of the IT8.7/2, known as the Q-60R1.
5.4.2 Printer Profiling
For printers, profile creation requires that a known digital image, containing swatches of various colors, be printed. The resulting output print must then be measured with a colorimeter. The profile generation software compares the readings from the colorimeter with the values in the digital image to create the printer's profile. The accuracy of the generated profile increases as the number of swatches used increases. Fig. 11 displays an image of a set of 226 color swatches generated by printer profiling software.
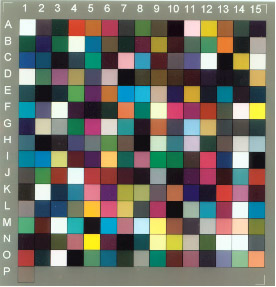
5.4.3 Monitor Profiling
Manufacturers of monitors usually provide either a generic profile or a model-specific profile. Such profiles, which generally provide an adequate level of color correction, may be available on the manufacturer's Web site.
Alternatively, simple profiles for monitors can be custom generated using one of several commercially available programs that measure a monitor's characteristics. Users of these programs must interactively match test swatches with carefully chosen patterns. A printed color card template may be provided that enables a user to compare the monitor's color side-by-side with that seen on the card under ambient illumination. Such programs are often supplied with high-end graphics monitors.
The creation of a more accurate profile for a monitor requires that colors generated by the monitor be measured using a clamp-on colorimeter or spectrophotometer. Profile-building software changes the digital values of the color displayed in a portion of the display, measures the color of that portion with the colorimeter, and creates the profile by comparing the values measured with the values sent.
6.0 Managing an Imaging System
This section discusses some of the issues associated with the specification, evaluation, and management of an imaging system, with an emphasis on those issues concerning the description and maintenance of image quality.
6.1 Determination of Requirements
Preparation for the development of an imaging system for any sizable conversion effort should begin with an assessment of the characteristics of the original objects and a determination of the fidelity with which they must be preserved. Curators, preservationists, imaging experts, and potential users of the images might be consulted concerning what they consider an adequate level of detail and color fidelity for their purposes.
See also, Guide 1, Developing Appropriate Capture Specifications and Processes.
6.1.1 Preservation of Fine Detail
A detailed visual examination of representative objects should be conducted, aided by magnification devices as appropriate. If the objects are drawn or painted, the investigation might include measurements of the widths of the finest lines. If the objects are silver halide photographs or negatives, the investigation might include measurements of film grain size. (Presumably, film grain detail would not need to be preserved.)
A spatial sampling frequency should be selected that will adequately preserve all relevant details in the master images; that frequency would normally be at least twice the inverse of the width of the smallest detail. However, since the storage volume of the uncompressed images and, most likely, the acquisition time will be proportional to the square of the sampling frequency, a trade-off point must be selected between the level of detail preserved and storage, transmission, and acquisition costs.
6.1.2 Selection of Number of Levels of Gray or Color
The examination should include using a densitometer and a colorimeter to measure the range of the objects' optical densities and colors. Precision conversion requires that the scanner or camera have a dynamic range and a color gamut that will preserve the full range of the objects' densities and colors. The dynamic range of a scanner or camera will be limited not only by the number of quantization levels but also by internal electronic noise, dark current, and, for shorter exposure times, statistical fluctuations in collected charge. For example, 8 bits per pixel would seem to provide a dynamic range of 256:1. In actuality, the dynamic range is often substantially less because levels near pure black (at 0) and pure white (at 255) are unavailable. Dark current and noise may prevent any level less than about 5 from being meaningful. Saturation at a level of 255 means that pure white should be set somewhat lower (i.e., at about 250). Thus, the dynamic range would be about 50:1 (250/5) for this example.
The color gamut of a three-color scanner or camera is inherently triangular (in CIE xy space), and most scanners cannot encompass the full range of colors that can be created by diverse pigments and dyes. Plotting the measured colors of the objects and the gamut of a scanner under consideration in CIE xy space will provide an indication of which colors will be preserved and which will not. The distance from the edge of the gamut to colors outside the gamut provides an indication of the degree of color loss. The distance from the gamut could be calculated using Delta E in CIELAB space to provide a more intuitive distance metric.
The number of bits allocated per color will determine the fineness with which color changes can be preserved. If extended regions of slowly varying color are present in the images, it may be advantageous to use a greater than normal number of bits per color. In most cases 8 bits per color (24 bits per pixel) provides adequately smooth transitions. If not, 12 bits per color (36 pits per pixel) may be required.
6.2 Preparation of Specifications
If a procurement of digital imaging equipment is to be conducted competitively, it is important that detailed, unambiguous specifications be prepared. To the extent possible, the specifications should reference accepted and open standards, such as those prepared by ISO Technical Committees. One or more sets of test patterns should be prepared. Those responsible for acquisition should consider disclosing to competing vendors the designs of the test patterns that will be used for system analysis. If suitably sized test charts appropriate for the conversion effort are not available off-the-shelf, one may have custom charts prepared. Some charts combine all of the required patterns on a single chart.
6.3 Comparative Evaluation of Systems
To the extent possible, image acquisition systems under consideration should be tested before procurement and, preferably, before the development of specifications, using both the test patterns described earlier and representative objects from the collection.
In preparation for a competitive procurement, a set of evaluation factors, along with relative weights for the factors, is typically prepared. The weighting should consider image quality, although it is quite difficult to determine precisely relative weights for the contributions to overall image quality of factors such as spatial resolution, color fidelity, and dynamic range. The weights would undoubtedly be content-dependent, and only detailed psychophysical experiments with subjects typical of the final users might provide a quantitative basis for their determination. Nonetheless, a set of weights might be prepared, based upon the opinions of potential users and experts in imaging.
6.4 Quality Control During Image Production
Ongoing quality control should be part of any large conversion effort. The characteristics of most image acquisition systems change over time, and periodic testing is required to ensure that the characteristics remain within specifications. Such a quality-control process should be distinct from the process of updating color profiles, through which the normal aging of illumination lamps and slowly changing amplifier gain may be accommodated. Characteristics of scanners and cameras that may change over time and that cannot be accommodated by the profiling process include spatial resolution, spatial uniformity, and gray-scale range. As dirt and foreign matter accumulate on a glass platen and on the optical elements and sensor, image quality is degraded. If multiple illumination sources are used, the balance between them may change in a manner for which profiling cannot compensate. Additionally, many factors are under operator control that may change as a result of shifting priorities or inattention to details.
Therefore, an imaging system should be tested on a schedule determined by experience-frequently at the beginning and decreasing in frequency thereafter, until any variations in the system's characteristics are detected occasionally. It is often possible to scan test patterns during shift changes for the operators or during periodic preventive maintenance. To the extent possible, the analysis of the test patterns should be conducted automatically through software. The analysis software should produce a report that displays the current values for the various image quality factors, along with their specified tolerance limits.
7.0 The User's Perspective
For the final user of the images, an important issue is whether the digital images retrieved are represented as faithfully as possible when displayed or printed. To ensure that they are, the user's display or printing system must be properly calibrated and profiled and the driver software must transmit the images to the display or printer in the format appropriate to the profile.
7.1 Measurement of Image Quality for Displays
The image quality of a computer display may be assessed visually using digitally generated test patterns similar to those described earlier for scanners and cameras. Test patterns for measuring spatial resolution, number of discernible levels of gray and color, and geometric accuracy may be easily devised using graphics or image-editing software. While scanned images of printed test patterns can be used in lieu of computer-generated test patterns, it should be remembered that the degradation associated with the scanning process may be difficult to separate from that associated with the display.
Particularly for CRTs, image quality varies as a function of position on the display. Achieving a uniformly high-resolution image for all regions on the display requires precise control of the CRT's electron beams. Advanced electron beam forming-and-deflection techniques are used in high-end color monitors to ensure uniform spot size and intensity.
The display adapter card should be configured to take maximum advantage of the monitor's capabilities. Even when the best monitor available is obtained, the images are in the correct format, and the profile is optimal, the settings for the graphics adapter often are not selected to take best advantage of the monitor's capabilities. Many users seem unaware of the capabilities of their display adapter and have chosen a default value for the active area (addressability) or the color palette (number of bits per pixel), thereby limiting the quality of displayed images.
Many users are unaware that the color temperature (that is, the balance among the red, green, and blue outputs) of a monitor may be changed. Most monitors are set up for a color temperature of 9300 °K, resulting in a very bright, but quite blue output. Instead, a color temperature of 6500 °K (or 5000 °K) might be chosen. That setting should provide output images with colors closer to those seen under daylight or ambient illumination.
If possible, the monitor and display adapter combination should be profiled. This can be done with the aid of commercially available profile-building software and a clamp-on colorimeter. It can also be done, albeit with somewhat less accuracy, with any one of several simple, inexpensive software packages that generate red, green, and blue bar patterns and require the viewer to select the best match to the pattern from a set of uniform colors. Such profiling software thereby effectively determines the gamma of the display for each of the colors. In combination with the known color coordinates for the display's phosphors, a simple display profile can then be generated. Alternatively, generic profiles suitable for most noncritical applications are usually available from the manufacturers of the more commonly used displays.
7.2 Measurement of Image Quality for Printers
The quality of printed images may be measured in a manner similar to that described for scanners and cameras, except that the input test patterns will be precisely generated digital images rather than hard-copy prints or transparencies, and the measurements will be performed visually or with optical instruments. The test patterns can be easily generated using graphics or image editing packages. The user will probably wish to design patterns for spatial resolution, gray-scale and color levels and range, spatial uniformity, and color fidelity.
The format in which an image is transmitted to a printer and the capabilities of the printer driver software can have a great effect on the quality of the printed images. Users should ensure that the best, most up-to-date driver (usually from the printer's manufacturer) is being used, rather than a driver that was designed to accommodate several varieties of printers. Users should also try to ensure that the driver is using the correct ICC-compliant color profile, that the images are being transmitted from the application to the printer driver in a color space appropriate to the profile, and that all other parameters selected during the image printing are the same as those used during the color profiling.
8.0 Appendix A: Definition of CIELAB Color Space
The following equations define the color space known as CIELAB:
|
|
|
|
|
|
|
|
| and Xn, Yn, and Zn are the values for the reference white. One often-used measure of color difference in CIELAB is known as Delta E and is defined by the following formula:
|
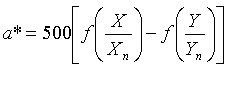
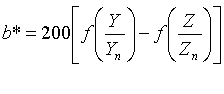
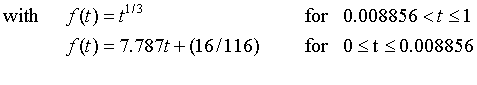
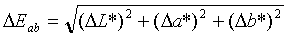
Guides to Quality in Visual Resource Imaging
4. Measuring Quality Of Digital Masters
Franziska Frey
© 2000 Council on Library and Information Resources
- 1.0 Introduction
- 2.0 Visual Attributes Associated with Quality
- 3.0 Objective Technical Attributes Associated with Quality
- 4.0 Measures
- 5.0 Image Processing
1.0 Introduction
The purpose of this guide is to identify the features used to define and measure the technical qualities of a digital master in relation to the original from which it is reproduced and that it is intended to represent. Some parts of this discussion may identify qualities whose implications are not yet completely understood. Other parts identify measures that are needed or are under development and thus are not yet commercially available.
After the photographs have been scanned, the technical quality of the files must be judged. This is different from benchmarking the scanning system, because one is not checking the performance of the system, but rather whether the masters meet the requirements set at the beginning of the project. However, some of the checks might be the same as or similar to those described in Guide 2.
1.1 Building Visual Literacy
Judging image quality is a complex task. The viewer has to know what he or she is looking for. The visual literacy required for looking at conventional images has to be translated for digital images (Ester 1990; 1994). A great deal of research must be done before it will be possible to fully understand how working with images as they appear on a monitor differs from working with original photographs. In addition, the people checking digital images often have different professional backgrounds than those who look at conventional photographs. To ensure consistency and coherence in the files produced, individuals involved in such a project must be trained before they begin their work. Training is needed, for example, in such areas as checking tonality of an image and checking sharpness. A good starting point is to have a person with a visual background as a member of the project team.
1.2 Looking at Pictures on a Screen
In most cases, the first access to the images occurs on a monitor. Very few studies have looked at the level of quality needed for viewing digital reproductions on a screen.
To quote Michael Ester (1990):
The selection of image quality has received little attention beyond a literal approach that fixes image dimensions at the display size of a screen. The use of electronic images has scarcely transcended the thinking appropriate to conventional reproduction media. No single level of image resolution and dynamic range will be right for every application. Variety still characterizes current photographic media: different film stocks and formats each have their place depending on the intended purpose, photographic conditions, and cost of the photograph. Perceived quality, in the context of image delivery, is a question of users' satisfaction within specific applications. Do images convey the information that users expect to see? What will they tolerate to achieve access to images? The ability of a viewer to discriminate among images of different quality is also a key ingredient in the mix.
It is helpful to ask users whether their expectations are met when comparing the digital master with the photographic original. In the best of cases, there should be no difference in the appearance of the two.
To achieve this goal, one must control the viewing environment. A common problem when using different computer systems or monitors is that the images look different when displayed on the various systems. Systems should be set up and calibrated carefully. This is often not done properly, and problems ensue. Moreover, even when systems are calibrated, measurements may not be taken correctly.
The best way to view a monitor is under dim illumination that has a lower correlated color temperature than that of the monitor. This reduces veiling glare, increases the monitor dynamic range, and enables the human eye to adapt to the monitor. This condition results in the most aesthetically pleasing monitor images. The situation gets more problematic if originals and screen images are viewed side by side, because in this case the observer is not allowed to adapt to each environment individually. It is a good idea to put a piece of tape over the monitor's brightness and contrast controls after calibration and to maintain consistent lighting conditions. Once calibrated, the monitor should need recalibration only on a monthly basis, or whenever conditions change. Comparing originals and screen images requires a suitable light booth or light table. It is important that the intensity and color temperature of such devices be regulated to match that of the monitor.
Monitor viewing conditions, as described in soon-to-be-published Viewing Conditions-for Graphic Technology and Photography (ISO 3664), will require the following:
- The chromaticity of the white displayed on the monitor should approximate that of D65. The luminance level of the white displayed on the monitor shall be greater than 75 cd/m2 and should be greater than 100 cd/m2.
- When measured in any plane around the monitor or observer, the level of ambient illumination shall be less than 64 lux and should be less than 32 lux. The color temperature of the ambient illumination shall be less than or equal to that of the monitor white point.
- The area immediately surrounding the displayed image shall be neutral, preferably gray or black, to minimize flare, and of approximately the same chromaticity as the white point of the monitor.
- The monitor shall be situated so there are no strongly colored areas (including clothing) that are directly in the field of view or that may cause reflections in the monitor screen. All walls, floors, and furniture in the field of view should be gray and free of posters, notices, pictures, wording, or any other object that may affect the viewer's vision.
- All discernible sources of glare should be avoided because they significantly degrade the quality of the image. The monitor shall be situated so that no illumination sources such as unshielded lamps or windows are directly in the field of view or are causing reflections from the surface of the monitor and so that there is an adequate shield or barrier to prevent 'spill' from these devices from striking the monitor.
1.3 Key Question: Scan from Original or Intermediate?
One frequent question regarding the reproduction quality of the digital master is whether scans should be made from the original or an intermediate. There are advantages and disadvantages to each approach. Because every generation of photographic copying involves some quality loss, using intermediates inherently implies some decrease in quality.
This leads to the question of whether the negative or the print should be used for digitization, assuming both are available. Quality will always be best if the first generation of an image, (i.e., the negative) is used. However, there may be substantial differences between the negative and the print. This is particularly true in fine-arts photography. Artists often spend a great deal of time in the darkroom creating their prints. The results of this work are lost if the negative, rather than the print, is scanned. The outcome of the digitization will be disappointing. Moreover, the quality of negatives varies significantly: one might show extreme contrast and the next might be relatively flat. Care has to be taken to translate this into the digital master. For example in the case of flat negatives, the bit-depth of the scanner must be high enough to discriminate between the different levels.
2.0 Visual attributes Associated with Quality
The visual characteristics of images and how these characteristics can be achieved on different systems are important parameters to consider when assessing the quality of the digital master. Users' computer platforms, color management systems, calibration procedures, color space conversions, and output devices will vary greatly. Almost every institution has a different setup for image access. This makes it more challenging to pick the right parameters and to make sure they remain useful over time. Ideally, all of the chosen parameters should be tied to well-documented standards to make it possible to take images safely into the future.
Furthermore, it is important that images always be checked on the output device they are intended for. Images that are intended for print should be judged on the print and not only on the monitor. This is because viewers accept lower quality when they judge an image on the screen than they do when viewing an actual print.
2.1 First Things to Check
2.1.1 Visual Sharpness
The first attribute to check is the sharpness of the images that have been scanned. Looking at the full image on the screen, the viewer might think the image is sharp. However, when the viewer zooms into the image, it might become obvious that the image has not been scanned with optimal focus. To evaluate sharpness, images should be viewed on the monitor at 100 percent (i.e., one pixel on the screen is used to represent each captured pixel of the image). The evaluation should include an area of the image that depicts details and edges.
There are different reasons why the scanned image may not be sharp. With a flatbed scanner, the mechanics holding the optics might be stuck. This would produce an out-of-focus scan. When using a camera with a helical focus mechanism on a vertical copy stand, it is important to prevent the lens from defocusing. This can result from the combined effects of gravity and the thinning of lubricants in the helical mechanism. Precautions are especially important if a 'hot' source of illumination (e.g., quartz, tungsten, or HMI lights) is used. A focus lock should be devised if it is not part of the original lens design. In addition, some scanning approaches include the use of a glass plate to flatten the original. This glass plate might not have been reset into the correct position after the originals were placed. In the case of digital cameras mounted on a copy stand, the image plane and the object plane might not be 100 percent horizontal; this would cause a blurred image. In any of these cases, the image should be rescanned.
2.1.2 Image Completeness (Cropping)
While looking at an image on the monitor, one must also ascertain that the whole image area has been scanned and that no part of it has been cropped accidentally. Often, an area larger than the image itself is being scanned. The area that does not contain any image information (e.g., a black frame) will have to be cropped after scanning. There are ways to automate this processing step.
2.1.3 Image Orientation
The image orientation has to be checked. Laterally reversed images are often a problem because it is not always easy to differentiate emulsion and base in old photographic processes. If necessary, the image will have to be flipped. It is advisable to scan the image with the correct orientation in order to minimize processing of the digital master, and to ensure maximal sharpness.
2.1.4 Skew
One must determine whether images have been scanned with a skew. Skewing occurs when the originals have not been placed squarely on the scanner. Depending on the angle of the skew and the image quality desired, it might be better to rescan the image instead of rotating it. Rotating introduces artifacts that will decrease image quality.
2.1.5 Flare
It is especially important to control flare and 'ghosting' and to examine each scan carefully for these problems. They are most likely to occur when light areas of the original object are adjacent to very dark areas. For this reason, white margins of the original that are not necessary to depict in the digital file should be masked or covered on the original before it is scanned.
2.1.6 Artifacts
2.1.6.1 Definition and implications
Image artifacts are defects that have been introduced in scanning, such as dropout lines, dropout pixels, banding, nonuniformity, color misregistration, aliasing, and contouring. (See Guide 2.) It is important to check for these artifacts, which can be consistent from image to image. Another form of artifact is a compression artifact. It will be dependent on the compression scheme used, the level of compression, and the image information.
2.1.6.2 How to determine artifacts
Artifacts can be seen by carefully looking at the images on a screen; for the evaluation, images should be viewed on the monitor at 100 percent. Dropout lines, dropout pixels, and banding can be seen best in uniform areas of the image. These types of artifacts are difficult to correct because they are introduced by the sensor or by the connection between the scanner and the CPU. They will in most cases already have appeared during initial tests of the imaging system. Compression artifacts can be seen in different areas of the image and are image-dependent.
2.2 Subjective Evaluations of Image Quality
2.2.1 Definition of Subjective Image Quality
Subjective image quality is determined by human judgment. Stimuli that do not have measurable physical quantities can be evaluated using psychometric scaling test methods. The stimuli are rated according to the reaction they produce on human observers. Psychometric methods give indications about response differences. Scaling tools to measure subjective image quality have been available only for the last 25 to 35 years (Gescheider, 1985).
In most cases, subjective evaluation does not include psychophysical testing but simply entails making the first evaluation of a scanned image by viewing it on a monitor. The viewer decides whether the image looks pleasing and fulfills the goals that have been stated at the beginning of the scanning project. This is important, because human judgment decides the final acceptability of an image. It should be emphasized, however, that subjective quality control must be done on calibrated equipment in a standardized viewing environment. Images might have to be transformed for monitor viewing. If images are intended to be printed, subjective quality control has to be done on the print, because, as mentioned earlier, the viewer is more forgiving when judging quality on a monitor.
2.2.2 What to Look for
Tone reproduction and color reproduction of the image must also be checked. These attributes are valid only for a particular viewing or output device. In addition, they depend on the rendering intent that has been set at the beginning of the project. If high bit-depth color data are being archived (i.e., higher than the bit-depth of the viewing or output device) and the rendering intent has been determined, an access file will have to be created at this stage. The file must be created on the viewing device currently being used. Several rendering intents can be chosen (Frey and Süsstrunk 1996):
- The images have been scanned with the intent of matching the appearance of the original photographic image. The digital image can be evaluated by visually comparing the original with a reproduction. Care has to be taken that the monitor is calibrated and has a contrast range similar to that of the original.
- Many collections contain photographs that were incorrectly exposed or processed. Some may be color casted or over- or underexposed; others may have the wrong contrast. In such cases, the scanner operator makes decisions about tone and color reproduction. The subjective evaluation of these scanned images will show whether these decisions led to a pleasing image that fulfills the expectations.
- In the case of older color photographs that are faded, the goal might be to render the original, unfaded state of the photograph. Visual inspection might include the use of additional information (e.g., objects that are depicted on the photograph that are also available in the object collection of the museum, or known things such as grass).
2.2.3 What to be Careful about
The most important point is to use a well-calibrated monitor under controlled viewing conditions. The tools used to compare the digital master with the original (e.g., a viewing booth or light box) need to be controllable and meet standards. In addition, one has to be well aware of any rendering requirements that have been established.
3.0 Objective Technical Attributes Associated with Quality
To achieve reproducibility and coherence, one must also include objective parameters in the evaluation of the digital master. Objective image quality is evaluated by means of physical measurements of image properties. This evaluation process is different from the benchmarking of the scanning system; however, the same tools are used for it. This step ensures that the established requirements, set after looking carefully at the original materials and at the users and the usage of the digital files, have been met. It ensures the quality of the digital masters and helps justify the investment being made (Frey and Süsstrunk 1996; Frey 1997; Frey and Süsstrunk 1997; Dainty and Shaw 1974).
Quantification of objective parameters for imaging technologies is a recent development. Theoretical knowledge and understanding of the parameters involved are available (Gann 1999), but the targets and tools needed to objectively measure them are still not available to the practitioner in the field. Furthermore, in most cases, the systems being used for digital imaging projects are open systems (i.e., they include modules from different manufacturers). Therefore, the overall performance of a system cannot be predicted on the basis of the manufacturers' specifications, because the different components influence each other. An additional hurdle is that more and more process steps are done in software yet limited information about these processes is available to users.
It should be kept in mind that scanning for an archive is different from scanning for prepress purposes. In the latter case, the variables of the scanning process are well known, and scanning parameters can be chosen accordingly. If an image is scanned for archival purposes, neither the future use of the image nor the impact of technological advances is known. Decisions concerning the quality of archival image scans are, therefore, critical.
Most of the available scanning technology is still based on the model of immediate output on an existing output device, with the original available during the reproduction process. The intended output device determines spatial resolution and color mapping. Depending on the quality criteria of the project, a more sophisticated system and greater operator expertise may be needed to successfully digitize a collection in an archival environment where the future output device is not yet known. In either case, the parameters that have been chosen and defined need to be carefully evaluated in the digital master.
3.1 Tone Reproduction
3.1.1 Definition and Implications
Tone reproduction is the matching, modifying, or enhancing of output tones relative to the tones of the original document. It refers to the degree to which an image conveys the luminance ranges of an original scene (or, in the case of reformatting, of an image to be reproduced). It is the single most important aspect of image quality. Because all the components of an imaging system contribute to tone reproduction, it is often difficult to control. If the tone reproduction of an image is right, users will generally accept it, even if the other attributes are not ideal.
Evaluating the tone reproduction target will show how linearly the system works, e.g., with respect to density values. Linearity, in terms of scanner output in this case, means that the relationship of tonal values of the image is not distorted.
Reproducing the gray scale correctly does not necessarily result in optimal reproduction of the images; however, if the gray scale is incorrect, the image will not look good. The gray scale is used to protect the archive's investment in the digital scans. Having a calibrated gray scale associated with the image not only makes it partly possible to go back to the original stage after transformations but facilitates the creation of derivatives.
The most widely used values for bit-depth equivalency of digital images are 8 bits per pixel for monochrome images and 24 bits for color images. An eight-bit-per-color scanning device output might be sufficient for visual representation on today's output devices, but it might not capture all the tonal subtleties of the original. To accommodate all kinds of originals with different dynamic ranges, the initial quantization on the charge-coupled device (CCD) array side must be larger than eight bits.
CCDs work linearly to intensity. To scan images with a large dynamic range, 12 to 14 bits are necessary on the input side. If these bits are available to the user and can be saved, it is said that one has 'access to the raw scan.'
It is often possible to get only eight-bit data out of the scanner. The higher-bit file is reduced internally. This is often done nonlinearly (nonlinear to intensity, but linear in lightness or brightness or density). A distribution of the tones linear to the density of the original leaves headroom for further processing but will in most cases need to be processed before viewing.
Operator judgments regarding color and contrast cannot be reversed in a 24-bit RGB color system. Any output mapping different from that of the archived image must be considered. On the other hand, saving raw scanner data of 12 or 16 bits per channel with no tonal mapping can create problems for future output if the scanner characteristics are not well known and profiled.
As an option, a transformation can be associated with the raw scanner data to define the pictorial intent that was chosen at the time of capture. However, no currently available software allows one to define the rendering intent of the image in the scanner profile. The user usually sets rendering intent during output mapping. Software is available that allows the user to modify the scanner profile and to create 'image profiles.' That process is as work-intensive as regular image editing with the scanner or image processing software. Some of the profile will be read and used by the operating system, some by the application; this depends on how the color management is implemented.
Because the output is not known at the time of archiving, it is best to stay as close as possible to the source, i.e., the scanning device. In addition, scanning devices should be well characterized spectrally, and the information should be readily available from the manufacturers.
3.1.2 How to Measure Tone Reproduction
Tone reproduction is applicable only if an output device is chosen to reproduce the images. Therefore, for objective testing one should refer to testing the Opto-Electronic Conversion Function (OECF) as explained in Guide 2 (ISO 14524/FDIS, ISO/TC42 January 1999).
Because the data resulting from the evaluation of the tone reproduction target are the basis for all subsequent parameter evaluations, it is important that this test be done carefully. In cases where data are reduced to eight bits, the OECF data provide a map for linearizing the data to intensity by applying the reverse OECF function. This step is needed to calculate all the other parameters. In the case of 16-bit data, linearity to transmittance and reflectance are checked with the OECF data. Any processing to linearize the data to density will occur later.
Neutral gray scale patches that vary from dark to light are used as targets (see Guide 3, Figure 4). This target characterizes the relationship between the input values and the digital output values of the scanning system. It is used to determine and change the tone reproduction. The digital values of the gray patches are determined in full-featured imaging software and compared with those of the target. The outcome of this test will either be the same as that for the benchmarking process or will show whether any requirements for tone reproduction are met.
See also, Guide 2, Tone Reproduction or Tonal Fidelity.
3.2 Color Reproduction
3.2.1 Definition and Implications
Three color reproduction intents can apply to a digital image: perceptual intent, relative colorimetric intent, and absolute colorimetric intent. The perceptual intent is to create a pleasing image on a given medium under given viewing conditions. The relative colorimetric intent is to match, as closely as possible, the colors of the reproduction to the colors of the original, taking into account output media and viewing conditions. The absolute colorimetric intent is to reproduce colors as exactly as possible, independent of output media and viewing conditions. This terminology is often associated with the International Color Consortium (ICC).
Scanning for an image archive is different from scanning for commercial offset printing. When an image is scanned for archival purposes, the future use of the image is not known. Will color profiles still be maintained or even used? Operator judgments regarding color and contrast cannot be reversed in a 24-bit RBG color system. Any output mapping different from the archived image's color space and gamma must be considered. On the other hand, saving raw scanner data of 12 or 16 bits per color with no tonal mapping can create problems for future output if the scanner characteristics are not well known and profiled. Archiving both a raw sensor data file in high bit-depth and a calibrated RGB 24-bit file at a high resolution for each image is not an option for a many institutions, considering the number of digital images an archive can contain.
3.2.2 Which Color Space?
The most important attribute of a color space in an archival environment is that it be well defined. The following issues should be taken into consideration when choosing a color space (Süsstrunk, Buckley, and S. Swen 1999).
- Archiving in an output space (e.g., device-specific RGB or CMYK). This is not advisable because it is device-specific, leads to color space variations, usually has the smallest color gamut, and makes future use for other purposes difficult. However, many legacy images have been produced in this space.
- Archiving in a rendered space (e.g., sRGB or Adobe RGB 98). This is applicable if the right space is chosen for the application needed. Currently the most effective archiving solution, it is easily controllable and is ideal for access images. However, problems can occur if the wrong image rendering or the wrong rendering space is chosen.
- Archiving in an unrendered space (e.g., ISO RGB or unrendered Lab). This is possible but expensive. Depending on the transformation, reversing to the source space might be impossible later. In addition, the creation of access images is needed.
- Archiving in sensor space (e.g., device-specific RGB). This is the best, most flexible solution, but it is device-specific, needs storage of all device characterization data, and requires the creation and storage of high-resolution access images for output.
- Archiving images with ICC profiles. This solution is not recommended with currently available methods. The profiles are changing, they contain vendor-specific proprietary tags, there is no guaranteed backward compatibility, and they are not easily updated.
There is more than one solution to the problem. The 'right' color space depends on the purpose and use of the digital images, as well as the resources available for their creation. Color management is important for producing and accessing the digital images, but not for storing them.
3.2.3 How to Measure Color Reproduction
Most of the procedures for measuring and controlling color reproduction are geared toward the prepress industry. The use of profiles, as standardized currently by the ICC, is not recommended in an archival environment; however, it might be the only solution available now. To take digital images into the future, it is imperative to document the procedures used and to update profiles until a standardized approach for the archival community is available. The use of targets such as IT8 is described in Guide 3.
An approach that is being developed and will be more useful in an archival environment is the metamerism index, described in Guide 2. Another standard in working stage that holds promise for the future is ISO 17321, Graphic Technology and Photography-Colour Characterization of Digital Still Cameras (DCSs) using colour targets and spectral illumnation, (ISO 17321/WD, ISO/TC42. 1999).
See also, Guide 2, Color Reproduction or Color Fidelity.
3.3 Detail Reproduction
3.3.1 Definition and Implications
Detail is defined as relatively small-scale parts of a subject or the image of those parts in a photograph or other reproductions. In a portrait, detail may refer to individual hairs or pores in the skin. Edge reproduction refers to the ability of a process to reproduce sharp edges.
People are often concerned about spatial resolution issues. This is understandable because spatial resolution has always been one of the weak links in digital capture. Additionally, the concept of resolution is relatively easy to understand. Finally, it was hard to achieve the needed resolution values with affordable hardware. Technology has evolved, however, and today reasonable spatial resolution is not very expensive and does not require large amounts of storage space.
3.3.2 How to Measure Detail Reproduction
The best measure of detail and resolution is the modulation transfer function (MTF). MTF was developed to describe image quality in classical optical systems. The MTF is a graphical representation of image quality that eliminates the need for decision making by the observer; however, one must have a good understanding of the MTF concept in order to judge what a good MTF is.
MTF of the master files is being measured according to the methods described in Guide 2 and Guide 3. The values will show whether the set target values for resolution have been met (ISO12233/FDIS, ISO/TC42, 1999; ISO 16067/WD, ISO/TC42, 1999).
Archival files should be scanned at the optical resolution of the scanning device to get the best quality. In some cases, it is necessary to resample the images to a certain resolution.
See also, Guide 2, Resolution of Modulation Transfer Function or Guide 3, Spatial Resolution.
3.4 Noise
3.4.1 Definition and Implications
Noise refers to random variations associated with detection and reproduction systems. In photography, granularity is the objective measure of density nonuniformity that corresponds to the subjective concept of graininess. The equivalent in electronic imaging is noise, the presence of unwanted energy in the signal. This energy is not related to the image and degrades it. (However, one form of noise, known as the photon noise, is image related.)
Noise is an important attribute of electronic imaging systems. The visibility of noise to human observers depends on the magnitude of the noise, the apparent tone of the area containing the noise, and the type of noise. The magnitude of the noise in an output representation depends on the noise present in the stored image data and the contrast amplification or gain applied to the data in processing the output. Noise visibility is different for the luminance or brightness (monochrome) channel and the color channels.
The noise test yields two important pieces of information. First, it shows the noise level of the system, indicating how many bit levels of the image data are actually useful. For example, if the specifications of the scanner state that 10 bits per channel are recorded on the input side, it is important to know how many of these bits are image information and how many are noise. Second, it indicates the signal-to-noise (S/N) ratio, which is essential for image quality considerations. The noise of the hardware should not change unless the scanner operator changes the way she or he works or dirt accumulates in the system.
Since many electronic imaging systems use extensive image processing to reduce the noise in uniform areas, the noise measured in different large area gray patches of the target may not be representative of the noise levels found in scans from real scenes. Therefore, another form of noise, so-called edge noise, will have to be looked at more closely.
See also, Guide 2, Noise.
3.4.2 How to Measure Noise
The Electronic Still Photography Group IT10 has designed a target. A software plug-in, with which to read and interpret the target, will soon be available (ISO 15739/CD, ISO/TC42, 1999). One could also use a gray wedge and check the noise in the different areas of the wedge by calculating the standard deviation of the pixel count values contained within each gray patch. A more detailed description can be found in Guide 2.
4.0 Measures
4.1 How to Judge the Numbers after Scanning
4.1.1 Setting Aim-point Values for Scanning
Benchmark values for the endpoints of the RGB levels are often specified when (or in case) images are scanned in RGB and reduced to eight-bit-per-channel. The guidelines of the National Archives and Records Administration, for example, ask for RGB levels ranging from 8 to 247 for every channel (Puglia and Roginski 1998). The dynamic headroom at both ends of the scale ensures that there is no loss of detail or clipping in scanning, and accommodates the slight expansion of the tonal range that is caused by sharpening or other image processing steps. The aim-point values can be checked by looking at the histogram. It is important to check that the histogram has been calculated from the entire image and not just from the portion of the image that is displayed on the screen.
4.1.2 Clipping
It must be confirmed that no clipping in the shadows or highlight areas has occurred during scanning. This is done by looking at the histogram. If clipping has occurred, these details will be lost in the digital file. The images will have to be rescanned.
4.1.3 Distribution of Digital Levels
The overall appearance of the histogram gives a good view of the integrity of the scan. A well-scanned image uses the entire tonal range (this will not be the case if histograms of 16-bit data are being examined) and shows a smooth histogram. If the histogram shows obvious spikes, artifacts or a noisy scanner could be the reason. If the histogram looks like a comb, it is likely that the image has been manipulated with image processing.
4.2 Inclusion of targets
4.2.1 Pros and Cons of Including Targets
Targets are a vital part of the image quality framework. After targets are scanned, they are evaluated with a software program. Some software components exist as plug-ins to full-featured image browsers, others as stand-alone programs.
Targets can be part of every scanned image, or the target information can be put into the image header. Putting a target into every scan might be particularly appropriate for very high-quality scans of a limited number of images. However, the target area will make the file size bigger. For large collections, a better approach might be to characterize the scanner well and to include this information in the file header. In this case, the images can be batch-scanned and processed later.
4.2.2 Which Targets Should be Used
Few targets are readily available on the market. For now, one approach would be to use a commercially available gray-scale target. A knife-edge target or sine wave target for measuring resolution will have to be included. Both can be purchased (see Guide 2). Software for analyzing the images is also available (see Guide 2). However, more sophisticated, user-friendly solutions are needed.
A set of targets and the necessary analyzing software is being developed within IT10 and will be on the market soon. To facilitate objective measurements of each of the four parameters, different targets for different forms of images (e.g., prints, transparencies) are needed. For reliable results, the targets should be made of the same materials as are the items that will be scanned.
4.2.3 How to Fit Targets into the Workflow
Full versions of the targets could be scanned every few hundred images and then linked to specific batches of production files. Alternatively, smaller versions of the targets could be included with every image. In any case, targets must be carefully controlled and handled. Targets must be incorporated into the workflow from the beginning so that operators become accustomed to using them. Standard procedures must be established to ensure that the targets are consistently incorporated into the workflow.
4.2.4 Documentation of Target Use
Information about the use of targets must be well documented. Target measurements, numbers, and types need to be linked to the files that have been scanned with them, preferably by putting that information in the file header. To enable work with images across platforms as well as over time, it is important that the imaging process be well documented and that the information be kept with every file.
5.0 Image Processing
5.1 Types of Image Processing
The initial processing should maximize image detail reproduction and S/N and get tone and color reproduction in line with a standard. This standard should, to some extent, maximize the image file information content through efficient use of the digital levels; however, it is also important to make the image data accessible (Holm 1996a).
5.1.1 Resampling
Resampling refers to changing the number of pixels along each axis after scanning. There are many different resampling algorithms. Bicubic interpolation provides the best image quality.
Resampling occurs in two forms: down sampling and up sampling. Scanning often occurs at a higher resolution than is necessary, and the required resolution is obtained by resampling the image. Aliasing can occur when the image data are downsized. To minimize its effects, low-pass filtering can be applied to the image before it is downsized. Up sampling should be avoided because no additional image information can be created.
5.1.2 Sharpening and Noise Reduction
Images often need to be slightly sharpened after scanning; however, sharpening is much more of an issue when one is processing images for output. There are several sharpening techniques, of which unsharp masking is the most popular. The level of filtering depends on the scanner and the material being scanned.
5.1.3 Tone and Color Correction
Depending on the rendering intent, various tone and color corrections may have to be performed. Tone and color correction can be done on images, e.g., to remove a cast on the image.
Preferably, all tone and color corrections should be controlled and done with the scanner software, if 24-bit images are being used as the master files. Tone and color corrections should be kept to a minimum after scanning in this case.
A question that often arises is whether images should be processed for monitor viewing before storing. Adjusting master files for monitor representation provides better viewing fidelity but means giving up certain processing possibilities in the future. However, a linear distribution of the tones in a digital image compared with the density of the original offers greater potential for future functionality, but images need to be adjusted before being viewed on a monitor.
In case of storing images at a higher bit-depth, all color and tone corrections are deferred until the image is being processed for output.
5.1.4 Defect Elimination
At this stage, dust and scratches are removed from the digital image. It is often very time-consuming; however, new technologies are being developed to automate this process during scanning.
5.1.5 Compression
Advances in image-data compression and storage-media development have helped reduce concerns about storage space for large files. Nevertheless, image compression in an archival environment has to be evaluated carefully. Because the future use of a digital image in this environment is not yet determined, one copy of every image should be compressed using a lossless compression scheme, or even left uncompressed, because current lossless compression schemes do not significantly reduce the amount of data.
Lossless compression makes it possible to exactly reproduce the original image file from a compressed file. New compression schemes, such as wavelets, that do not produce the well-known artifacts that JPEG-compressed files show are not readily available. The advance of JPEG 2000 will have to be followed closely.
5.2 Fitting Image Processing into the Workflow
5.2.1 Sequence of Applying Different Image Processing Steps
Image quality is affected by the sequence of applying different image processing steps. It is important to be aware of the effects of different processing algorithms. It has also to be kept in mind that the future use of the images is not known. Ideally, all image processing should be delayed until the time an image is actually used and its image rendering and output characteristics are known. This would require that data be stored with a bit-depth of more than eight bits per channel. Most available workflow solutions do not allow this.
5.2.2 Effects of Image Processing on Processing in the Future
Image data are best stored as raw capture data. Subsequent processing of these data can only reduce the information content, and there is always the possibility that better input-processing algorithms will be available in the future. The archived image data should, therefore, be the raw data, along with the associated information (e.g., sensor characteristics) required for processing, whenever possible.
Tone and color corrections on eight-bit-per-channel images should be avoided, if possible. Using them causes the existing levels to be compressed even further, no matter what kind of operation is executed. To avoid the loss of additional brightness resolution, all necessary image processing should be done on a higher bit-depth file, and requantization to eight-bit-per-channel images should occur after any tone and color corrections.
Most important, master files that have been well checked are a sound investment for the future.
Guides to Quality in Visual Resource Imaging
5. File Formats for Digital Masters
Franziska Frey
© 2000 Council on Library and Information Resources
- 1.0 Introduction
- 2.0 Attributes Associated with Performance
- 3.0 Attributes Associated with Persistence
- 4.0 Documentation
1.0 Introduction
The purpose of this guide is to identify how to contain and formally describe the qualities of digital masters as discussed in Guide 4 in this series. This guide focuses on the features of the containers-the file formats-that affect the performance of the digital master and the ability of the custodian of the master to ensure that it persists over time as technology changes. Some parts of this discussion may identify technical requirements for product features that need to be, or may already be, the subject of further research and development, and may not yet be commercially available in a suitable form.
Because file formats are evolving, this guide generally does not include concrete specifications of file formats for different applications; instead, it gives guidance in what to look for when choosing a file format for the digital images. Before deciding on a specific format, the user will have to check the most recent information on file formats. A list of sources that can help with that search appears at the end of the series.
Choosing a file format is one of many decisions that have to be made when undertaking a digital project. It is a decision that comes relatively late in the process. Especially for the digital master, issues such as openness of the format and longevity are in the forefront. Only a few formats actually comply with archival standards.
Besides longevity issues, several interdependent technical considerations have to be looked at, including quality; flexibility; efficiency of computation, storage, or transmission; and support by existing programs.
Design goals may be conflicting, as indicated in the following list, which is based on one authoritative source (Brown and Sheperd 1995):
- Memory. Some formats emphasize the presence or absence of memory. For example, the TIFF format has a design goal of modifying a raster image in place, without reading the entire image into memory. This can be a concern with master files, which are by definition large.
- Accuracy. The accuracy of images is sometimes critical and sometimes negotiable. In some cases, the accuracy of the data can be decreased to save memory, e.g., through compression. In the case of a digital master, however, accuracy is very important.
- Speed. The ability to access or display a data set at a certain speed is critical to certain applications. In the case of the master file, this is not a concern.
- Device independence. This is a very important aspect for master files because they will be most likely used on various systems.
- Robustness. Some formats are concerned with transportation accuracy for the data. A robust format contains several layers of defense against corruption, so that if part of the data is corrupted, the data set does not completely fail to produce an image. This is most widely used in television signals or data on audio CDs.
- Extendibility. The simplest definition states that a data format can be modified to allow for new types of data and features in the future. A more stringent definition states that a format can be extended without invalidating previously implemented readers of the format.
- Compatibility. Compatibility with prior versions of data set definitions is often needed for access and migration considerations. However, compatibility carries a penalty in performance and in increased size of both code and data.
- Modularity. A modular data set definition is designed to allow some of its functionality to be upgraded or enhanced without having to propagate changes through all parts of the data set.
- Plugability. Plugability is related to modularity. It permits the user of an implementation of a data set reader or writer to replace a module with private code.
- Openness. A standard is designed to be implemented by multiple providers and employed by a large number of users. A truly open standard also has an open process for development and enhancement.
- Scalability. The design should be applicable both to small and large data sets and to small and large hardware systems. Thus, access time should increase no more than linearly with increasing data set size.
All of these are good goals for design, and it would be extremely convenient if they could all be satisfied by a single data format. Given current technology, however, it is not possible, for example, to have both real-time access to data and device-independent data. Real-time access requires special and specific hardware devices. Therefore, the result of this set of conflicting goals is a large set of diverse data formats to meet different needs.
The goals of extendibility and robustness are very similar. Both require that a data reader recognize and skip unknown data and resume reading data at some subsequent location in the data stream, when the reader recognizes valid data. It is important to keep in mind, however, that the more complicated the format, the higher the chances of future errors due to bytes that cannot be read anymore.
Functionality is key to any data format. One must be able to store application-dependent data that meet a user's needs. Application data should be separated from graphical data, e.g., in the form of extended file headers.
2.0 Attributes Associated with Performance
2.1 Ability of Files to Open Easily on Any Platform
Most file formats were designed to work best with a particular platform. All computer operating systems (e.g., Unix, DOS, Windows, Macintosh) have strict rules governing file names. The maximum length of a file name and the type of characters it will accept are matters that confront all operating systems.
2.1.1 Encoding Byte Order
Binary encoding refers to a broad range of encoding schemes that are machine-dependent. For files to be readable on different machines, the byte order must be known. The National Archives and Records Administration (NARA) guidelines therefore state, for example, that file formats should be uncompressed TIFF files with Intel byte order and header version 6 (Puglia and Roginski 1998).
Binary encoded data can use different byte orders and, in the case of bitmap images, can use different bit orders as well. Where there is more than one bit per pixel in a bitmap image, several variations are possible. Each pixel's multi-bit value could be recorded at once, such as a 16-bit value being recorded as two consecutive bytes, or the image could be broken into 16 one-bit-deep bit planes (Kay and Levine 1995).
Byte order usually depends on the processor used in the computer. It, too, can vary. One variation is the ordering of least and most significant bytes (LSB and MSB, respectively) for numbers of more than one byte. In the memory (and generally in the files) of personal computers and other Intel CPU computers, the LSB comes first; in Motorola CPU systems such as Macintosh, the MSB comes first. Data stored in files on these systems usually reflect the native order of the machine (i.e., the order in which data are stored in memory).
Because of these differences, a graphics file format must record some information about the bit and byte order if it is to be used by computers from different manufacturers. A file format developed for a particular computer will generally lack byte-order information; however, if the CPU of that system is known, the correct order can be implied.
Before selecting a file format, therefore, one must know whether the byte order in which the file is written makes the file readable on different systems. For example, when saving TIFF files, Photoshop asks whether the byte order for Intel (PC) or Motorola (MAC) should be used (Blatner and Fraser 1999).
2.1.2 File Naming
Another important issue is the file naming system. To quote Michael Ester (1996):
There are two approaches to file naming. One is to use a numbering scheme that reflects numbers already used in an existing cataloging system; the other is to use meaningful file names. Both approaches are valid, and the best fit for a certain environment or collection has to be chosen.'To take a simple example, consider giving an image a name. This can begin as a straightforward task of giving each image file the same name or identifier as the image from which it was scanned. This assumes, of course, that the name will fit in a filename. Next, there are perhaps three or four smaller images created from the master image, or alternatively, versions of the image in different formats. More names needed. The image variations will probably not be stored in the same place, so now we need to come up with names for the places we put them and what goes into these different areas so we don't mix them up. Finally, we need to record all of the names somewhere so that other people and computer programs can find the images and versions of images they need. What starts out as giving one file name to an image grows to a many-sided production step, and names are only one characteristic of the image we need to track.'
When developing a file-naming scheme, one must have a good understanding of the whole project. What kind of derivatives will be needed? How many images will be scanned? Will they be stored in different places? Will the files be integrated in an existing system (e.g., a library catalog), or will it be a new, stand-alone image base? Because some issues will be system-specific, all these questions have to be discussed with the people running the computer system on which the files will be put.
Windows 98, Macintosh, and UNIX systems allow both longer file names and spaces within the file name than other systems do. Each operating system has its own rules and preferences. The use of special characters, in particular, has to be checked before a naming scheme is chosen.
Pre-Windows 95 Applications do not support long file names. They used an 8.3 system, meaning the file name was eight characters long, followed by a three-character extension (i.e., the characters after the dot). Long file names can be up to 255 characters long and contain spaces. The long file names, the aliases, and the DOS file names can contain the following special characters: $, %, ', -, _, @, ~, `, !, (, ), ^, #, and &. Windows 98 creates two file names when a file is not named within the old DOS naming convention. The system automatically generates an alias file name consisting of the first six characters of the long file name, followed by a tilde (~) and a number. In this case, it is important that files can be distinguishable by the first six characters. This might be needed in a networked environment, where many PCs continue to run Windows 3.1x and DOS. Therefore, it has to be taken into consideration whether files will have to be shared over a network with someone who cannot read long file names or who uses the file in a pre-Windows 95 application.
Many extensions have standard meanings and are employed widely. Care has to be taken when dealing with nonstandard extensions because a file extension does not always refer to a certain file format. A list of the most common extensions can be found at Webopedia, an online encyclopedia related to computer technology, http://webopedia.internet.com/TERM/f/file_extension.html. The extension is assigned by the application that created the file. The Macintosh hides its file extensions with invisible type and creator codes, and the operating system deals with them.
Another issue that has to be taken care of is the metadata associated with the different file formats. All the metadata inherent to a specific file format have to be read and made usable for an application or for conversion into another file format.
Since the digital master files might be used on different systems, the following cross-platform issues have to be looked at carefully.
2.2 Scope (Size of Containers)
The operating system and applications determine the maximum file size. At this time, maximum file sizes (usually expressed in gigabytes) exceed by far the file sizes that will be produced for a digital archive.
2.3 Pros and Cons of Various Formats
File formats must be compared in terms of ability to contain:
- Detail (maximum number of pixels)
- Tone (maximum number of bits per pixel)
- Color (color space associated with format)
- Administrative metadata (number of file headers)
Some of these aspects are more pertinent for derivative files. File formats that do not make it possible to keep all the information inherently available in the digital master are not considered valid candidates for digital masters.
From the currently available formats TIFF is the one that can be considered most 'archival.' It is a very versatile, platform-independent, and open file format, and it is being used in most digitizing projects as the format of choice for the digital masters.
It is also important to have a closer look at the format in which the data is written onto the media, e.g., tar and ISO 9660. This format is dependent on the type of media. Open and non-proprietary formats are also in this case a must in an archival environment. The format that has been used to write the data has to be documented.
2.4 Image Processing (Viability to Create Deliverable Images from Digital Masters)
Choosing the wrong file format or data encoding scheme in form of color space for the digital master can make it impossible to create specific deliverable images (Süsstrunk, Buckley, and Swen 1999; Frey and Süsstrunk 1997). Depending on the specifics chosen, there are different reasons for this, which are discussed below. Rendering images for a specific purpose might be very useful; however, it has to be done correctly, and the information about the rendering process has to be kept with the image.
2.4.1 Open Versus Closed Formats
When choosing a format, one must consider the software/format combination in the future archiving environment. Will the software packages allow the chosen format and all the additional information, such as tags, to be read? Are certain proprietary transformations needed to open and display the file format? Installing the right filters can solve this, but this makes a file format vendor-specific and requires the future user to have the right reading filters.
On the other hand, it must be ascertained that a software application supports writing files in the chosen file format. With a proprietary vendor-specific file format, this possibility might not exist.
Most vendors realize that it is important that their systems be open. They offer filters to write and read files in the most common file formats. However, saving the files in a format other than the system's native format might make it impossible to use certain special features of the system.
2.4.2 Color Spaces Natively Optimized for the Screen
Color spaces may be optimized for images being viewed on a monitor. The sRGB format, for example, has been developed as an average monitor space for the World Wide Web. It is a useful output space for images that will be displayed on monitors of unknown characteristics. No additional transform is necessary to view the images.
Images in sRGB display reasonably well even on uncalibrated monitors. The format is sufficiently large to accommodate most photographic reproduction intents (see Guide 4). However, sRGB is currently designed only for 24-bit data and leaves no bits for modifying the image or mapping it to another output device. There is a serious mismatch between the sRGB gamut and the CMYK gamut needed for printing.
All in all, sRGB is a valid format for access images that are used only on the monitor. Future repurposing possibilities of this format are very limited.
2.4.3 Color Spaces Natively Optimized for Print
Certain CMYK color spaces (e.g., CMYK SWOP) are used for images that are ready to be printed. These color spaces are used often in the prepress industry. The color separations that have been created from the RGB files are fine-tuned to match the color gamut of the chosen output device.
Because of differences in color gamut, it is often impossible to repurpose these images into an RGB color space. CMYK images are rarely found in an image archive and should generally not be used for the digital master.
2.4.4 Telescoping ('Russian Doll') Formats such as FlashPix
Tiling formats like FlashPix [http://www.kodak.com/US/en/digital/flashPix] have the advantage of very fast transmission, because only the part of the image that is needed is transferred to the client.
FlashPix has other useful features such as the ability to store viewing parameters (e.g., crop, rotate, contrast, and sharpen) within the file without affecting the original pixel values. The image can also be adjusted for the chosen output device without affecting the original pixel values. All image processing can, therefore, be done in one step before the final rendering of the image. This ensures that no quality is lost due to multiple image processing steps.
Support for FlashPix was strong in the beginning, especially in the consumer market. However, FlashPix did not gain the sustained reception that was predicted and never really caught on. New formats will carry forward the tiling aspect of FlashPix while adding other aspects such as lossless compression and higher bit-depth per channel. New data encoding schemes discussed in JPEG2000 will most likely adopt some of the FlashPix features.
3.0 Attributes Associated with Persistence
3.1 Standards
Standards are an essential basis for sharing information, both over current networks and in the future. Standards will ensure the protection of the long-term value of digital data. Several types of standards are being used. Industry standards are available and are often given stamps of approval from official standards organizations. Postscript (EPS) and TIFF are examples of such industry standards.
3.1.1 Who Maintains Standards
Standards are developed by various standards committees. There are international and national standards groups. The following list contains the names of some of the more important groups in the imaging field (Brown and Sheperd 1995).
| International standards groups | |
| ISO | International Organization for Standardization |
| ISO TC42: Technical Committee Photography | |
| ISO TC130: Technical Committee Graphic Arts | |
| IEC | International Electrotechnical Commission |
| ITU | International Telecommunications Union |
| CIE | Commission Internationale de l'Eclairage |
| IPA | International Prepress Association |
| CEN | European Committee for Standardization |
| National standards groups and associations interested in standards | |
| ANSI | American National Standards Institute |
| NIST | National Institute of Standards and Technology, US Department of Commerce |
| PIMA | Photographic and Imaging Manufacturers Association |
| SMPTE | Society of Motion Picture and Television Engineers |
3.1.2 Opportunities for Participation in Standards Development
Standards are not developed in a laboratory and presented to the world only after they are finished. Standards development is a team effort, and it is possible for individuals to join a standards group. Rules and regulations for participation can be obtained from the group secretary or chair.
Standards represent a consensus of the best thinking of those who are most active in the field as well as of other individuals from widely different backgrounds, training, and interests. This ensures that the views of one particular discipline do not predominate. Standards can resolve differences of opinion and remove the problem of deciding which expert to believe. Consequently, standards are a convenient source of unbiased information.
3.1.3 Criteria to Judge Openness
The openness of a file format can be judged in different ways. One way is to learn whether a particular file format is being used by other institutions. It is usually helpful to look at what large institutions are using, because they commonly spend a share of their large resources on finding the best solution. It can also help to see how many software packages and systems are supporting the chosen file format. If several software packages are allowing the use of a file format, the format will probably be in existence for quite a while. A third idea is to see how easy it is to find full documentation on a specific format that is readily available for every user. On-line resources about standards should be maintained and up to date.
3.2 Archival Format for Digital Photography: Myth or Reality?
The efficient storage and transfer of image data have been sources of difficulty throughout the history of electronic imaging. Also of importance is the need for interchange of metadata associated with images. More sophisticated image processing routines require more information about image capture and display. These factors have resulted in a growing number of image file formats, many of which are incompatible. The ISO42-WG18 Committees (Electronic Still Photography; http://www.pima.net/it10a.htm) reviewed a variety of file formats in an attempt to find one with the following attributes:
- efficient storage of image data in both compressed and uncompressed forms;
- ability to accept image data in a wide variety of formats;
- capability for standardized storage of image attribute information to facilitate image processing;
- extendibility for the accommodation of future needs; and
- reasonably wide levels of current acceptance.
No formats completely satisfied these requirements, and work was done to devise new formats using several popular existing formats as a base. This has led to the work on ISO 12234-2, which is described in the following paragraph (Holm 1996b; ISO 12234-2/DIS, ISO/TC42 1998).
3.2.1 TIFF/EPS (ISO 12234-2)
TIFF 6.0 was taken as the base format. A major goal of the IT10 Committee in designing Tag Image File Format/Electronic Photography (TIFF/EPS) was to identify possibilities for data storage forms and attribute information. TIFF/EPS is also meant to be as compatible as possible with existing desktop software packages. Most of the problems that may arise through the use of TIFF/EPS are a result either of features of TIFF 6.0 that could not be changed without affecting compatibility or of the large number of optional tags. The IT10 Committee recognizes that increasing the number of formats at this time may not help with compatibility issues, and until all the features desired by users are available in a single format, multiple formats will be necessary. The ISO 12234 and TIFF/EPS standards should facilitate the use of electronic cameras for image capture and make other types of electronic imaging easier to deal with from a photographic standpoint. As this process occurs, currently available file formats may begin to merge.
Time will show whether industry is buying into this standard and making applications compatible. Because most of the large imaging companies have been involved in creating TIFF/EPS, the chances that this will happen are good. TIFF for Imaging Technology (TIFF/IT) is another version of TIFF that has been developed within the graphic arts; however, it does not address a number of points relevant for photography. TIFF/IT and TIFF/EPS will probably merge in the future, perhaps under the umbrella of TIFF 7.0.
3.2.2 Universal Preservation Format
The Universal Preservation Format (UPF) grew out of an initiative of WGBH Educational Foundation. As described by its developer, 'The UPF is based on the model of a compound document, which is a file format that contains more than one data type. The Universal Preservation Format is a data file mechanism that uses a container or wrapper structure. Its framework incorporates metadata that identifies its contents within a registry of standard data types and serves as the source code for mapping or translating binary composition into accessible or useable forms. The UPF is designed to be independent of the computer applications that created them, independent of the operating system from which these applications originated, and independent of the physical media upon which it is stored.' (WGBH 1999)
Before UPF was defined, information was collected in several ways to find out all the requirements of a digital archiving system for users. Technical requirements for UPF have been set and stated. However, without a clear buy-in from the industry, this standard will not be born.
3.2.3 Implications of Version (e.g., TIFF 6.0 vs. TIFF 5.0)
It is important to state what version of a file format is being used. In the case of TIFF, specifications of both versions have been published and can be found on the Web. However, it is usually advisable to use the newest version of a file format (in this case TIFF 6.0). Issues of incompatibility can arise when using the different versions of TIFF; i.e., a file created in one version might not be readable with a certain type of software. Attention also needs to be paid to the format version used by a scanner or software application for writing the files.
3.3 Color Representation
3.3.1 How to Calibrate Images for a Long-term Repository Rather than to a Specified Device Profile
It is important to know how to calibrate images for a long-term repository rather than to a specified device profile (Süsstrunk, Buckley, and Swen 1999). Closed-production environments, in which skilled operators manage color, are disappearing. The current International Color Consortium (ICC) architecture is not applicable for some professional applications, even in an archival environment. ICC profiles are changing; they contain vendor-specific, proprietary tags; there is no guaranteed backward compatibility; and they are not easily updated.
The need for good, unambiguous color has resulted in the development of new, 'standard' RGB color spaces that are being used as interchange spaces to communicate color, or as working spaces in software applications, or as both. Discussion continues about color representation, in the prepress area and for image databases. Various new standards have been developed during the past years. Currently, there is no 'one-size- fits-all' approach; i.e., no single color space representation is ideal for archiving, communicating, compressing, and viewing color images. Standard color spaces can facilitate color communication: if an image is a known RGB, the user, application, or device can unambiguously understand the color of the image and further manage it if necessary.
The general color flow of a digital image has to be defined before individual color spaces can be examined. After an image is captured into source space, it may first be transformed into an unrendered image space, which is a standard color space describing the original's colorimetry. In most workflows, however, the image, being the color space of some real or virtual output, is directly transformed into a rendered image space.
When a scanner or digital camera captures an original, its first color space representation is device- and scene-specific, defined by illumination, sensor, and filters. In the case of scanners, the illumination is more or less constant for each image. When images are archived in this space, scanner or camera characterization data (e.g., device spectral sensitivities, illumination, and linearization data) have to be maintained.
The purpose of an unrendered image color space is to represent an estimate of the original's colorimetry and to maintain the relative dynamic range and gamut of the original. XYZ, LAB, and YCC are examples of this type of color space. Work is under way on defining an unrendered RGB space, called 'ISO RGB.' Unrendered images need to be transformed to be viewable or printable. Unrendered image spaces can be used for archiving images when it is important that the original colorimetry be preserved so that a facsimile can be created later. The advantage of unrendered image spaces, especially if the images are kept in high-bit depth, is that they can later be tone- and color-processed for different rendering intents and output devices. However, reversing to source space might be impossible later because the transformations used to get to the rendered space are nonlinear or the transformations are not known.
Images can be transformed into rendered spaces like sRGB, ROMM RGB, and Adobe RGB 98 from either source or unrendered image spaces. The transforms are usually nonreversible, because some information from the original scene encoding is discarded or compressed to fit the dynamic range and gamut of the output. Rendered image spaces are usually designed to closely resemble some output device conditions to ensure that there is minimal future loss when converting to the output-specific space. Some rendered RGB color spaces, such as sRGB, are designed so that no additional transform is necessary to view the images.
With the exception of the graphic arts, images are rarely archived in output space, such as device- and media-specific RGB, CMY, or CMYK spaces.
The best thing to do at this time is to characterize and calibrate the systems and scan into a well-described, known RGB color space. In this way, it will be possible to update just one profile if another space is chosen later.
3.4 Compression
Compression is mainly an issue for transferring data over networks. Image compression in an archival environment must be evaluated carefully. At present, most institutions store master files uncompressed. Instead of adapting the files to fit current limitations associated with bandwidth and viewing devices, the digital masters remain information-rich, ready to be migrated when new, perhaps better, file formats or compression schemes become available. Visually lossless compression might be used for certain types of originals, such as documents, where legibility is the main issue.
Compressions may be numerically or visually lossless. Numerically lossless means that no data are lost because of compression; all data are recoverable to their original precision. Visually lossless (but numerically lossy) means that some data are lost during compression but the loss is not discernible by the human eye (Brown and Sheperd 1995).
A position on lossy versus lossless compression is a matter of weighing different issues (Dale 1999). Compression decisions must be combined and weighed with others in the imaging chain. However, it has to be kept in mind that if one crucial bit is lost, all of the file information might be lost, even in the case of lossless compression.
3.4.1 How to Avoid Proprietary Traps
Some institutions have decided to use a specific proprietary file format that includes a form of compression. While this might be a good solution for the moment, any proprietary solution may cause problems later. If a company decides to discontinue support of a certain system, there might be no way, or only an expensive way, out of this trap. A contract should state that if the company does not support a certain system anymore, it will provide the full description of the system. In most cases, companies will not be willing to sign such a contract. Thus, a proprietary system is not a valid solution in an archive. Another problem with proprietary solutions is that it is never 100 percent clear to the user what is being done to the bits and bytes of the image file.
3.4.2 File Sizes
The full benefit of compression, i.e., having much smaller files to store, comes from very high compression ratios-something not to be considered with master files because of the loss of quality. A lossless compression scheme reduces the file size by about a factor of two.
3.4.3 Speed of Decompression
The length of time algorithms take to compress and decompress high-quality, high-resolution images must be kept in mind. This time is much longer at higher-quality settings (lower compression ratios), which are appropriate for master image files, than at lower-quality settings. Longer compression and decompression times affect processing time and users, and minimize the potential benefit of file compression. Higher compression ratios (lower image quality) are more appropriate for use with lower-resolution access images, where users can derive greater benefit because of the faster compression or decompression times and where loss of image quality is of less concern.
3.5 Storage
The long-term preservation of visual resources is very demanding. The principles of secure preservation of digital data are fundamentally different from those of analog data. First, in traditional preservation there is a more or less slow decay of image quality, whereas digital image data either can be read accurately or cannot be read at all. Second, every analog duplication process results in a deterioration of the quality of the copy. Repeated duplication of the digital image data, by contrast, is possible without any loss.
In an idealized traditional image archive, the images would be stored under optimal climatic conditions and never touched again. Consequently, access to the images would be severely hindered while the decay would be only slowed. A digital archive has to follow a fundamentally different strategy. The safekeeping of digital data requires active, regular maintenance. The data have to be copied to new media before they become unreadable. Because information technology is evolving rapidly, the lifetime of both software and hardware formats is generally less than that of the recording media.
The fundamental difference between a traditional archive and a digital archive is that the former is a passive one, with images being touched as little as possible, while the latter is an active one, with images regularly used. However, this often works only in theory. If a document is known to be available, it is likely to be used. Therefore, in practice, original documents are frequently handled as soon as they are available in digital form. The future will show whether a high-quality digitization can satisfy some of the increased demand for the original.
The digital archive needs an active approach in which the data, and the media it is recorded on, are monitored continually. This constant monitoring and copying can be achieved with a very high degree of automation (e.g., using databases or media robots), and is quite cost-effective.
Professionals in photographic preservation rarely differentiate between visual information and the information carrier itself. In traditional photography, such a distinction is superfluous, because visual information cannot be separated from its support. Therefore, the conservation of an image always implies the conservation of the carrier material. The situation is quite different with digital images, because the medium can be replaced.
The distinction between information and support leads to new reflections about the conservation of digital information. The interpretation of numeric data requires that the medium on which the data are recorded be intact, that the reading machine be working, and that the format in which the data are recorded be well known. If any of these prerequisites is not met, the data are lost.
One of the major obstacles to the long-term preservation of electronic media is the lack of standards (Adelstein and Frey 1998). Existing industry standards tend to be distillations of vendor responses to the imperatives of the marketplace. Preservation is seldom a priority.
3.5.1 Choice of Media
Much has been written about the stability of digital storage media, and several reports and test results are available. However, standardization in this area is still lacking, and it is often difficult to compare the results of different tests. Media stability is just one of the issues that must be evaluated. Having a migration plan that considers all the issues is difficult but it is the only way to ensure that data will survive.
It is also important to consider the hardware/media combination for writing the data. Hardware is often optimized for media from a certain manufacturer.
Finally, storage conditions for the media need to be chosen correctly.
3.5.2 Magnetic Media
The ANSI group that worked on magnetics recognized that the critical physical properties are binder cohesion, binder-base adhesion, friction, clogging of magnetic heads, dropouts, and binder hydrolysis (Smith 1991). Magnetic properties of interest are coercivity and remanence. The group agreed on test procedures for adhesion, friction, and hydrolysis, but cohesion and dropouts are difficult to measure and require extensive development work. They are also very system-dependent.
The consumer is left without a recognized specification to use in comparing tape products, and the manufacturer without a standardized procedure to use in evaluating tape life. For the user, the only option is to purchase tape with recognizable brand names.
It is well accepted that good storage conditions prolong the life of tapes (Van Bogart 1995). The accepted recommendations have been incorporated into an ANSI document on the storage of polyester base magnetic tape that was published in 1998 as IT9.23 (ANSI/PIMA IT9.23-1998).
The ANSI document covers relative humidity, temperature, and air purity. Two types of storage conditions are specified, one for medium-term storage and the other for extended-term storage. The former is for a life expectancy of 10 years, and the latter is for materials of long-term value. More rigid temperature and humidity conditions are specified for extended-term storage; such conditions should extend the useful life of most tapes to 50 years.
| Temperature (°C) | Relative Humidity (%) | |
| Medium term | 23 | 50 |
| Extended term | 23 | 20 |
| 17 | 30 | |
| 11 | 50 |
The lowest recommended temperature is 8° C, because subfreezing storage may create problems. Another storage concern is the avoidance of external magnetic fields.
Work has been started on recommendations for the care and handling of magnetic tape. Topics to be covered include cleaning, transportation, use environment, disaster procedures, inspection, and staff training. Work in the different standards groups has to be followed closely.
3.5.3 Optical Disc Materials
Unlike magnetic media, optical discs are not only manufactured in a variety of sizes but also can be composed of very different materials. The most common substrates are polycarbonate and glass. The image-recording layer features various organic or inorganic coatings; since the discs operate by several different mechanisms, many different coatings can be found. For example, write-once discs can record information by ablation of a thin metallic layer or a dye/polymer coating, by phase change, by metal coalescence, or by change in the surface texture. Read-only discs have the surface modulated by molding of the polycarbonate substrate. Erasable discs are based on magneto-optical or phase-change properties. Despite this vast dissimilarity in composition, optical discs have an important advantage over magnetic materials, namely, that their life expectancy is more certain. Optical discs are recorded and read by light and do not come into contact with moving or stationary parts of equipment. Therefore, their useful life is mainly determined by the properties of the material itself; physical wear and tear is less of an issue than it is with magnetic tape. As a result, several laboratories use the Arrhenius method to predict the longevity of discs. A method for testing the life expectancy of CD-ROMs has been published (ANSI/NAPM IT9.21-1996).
Optical discs can fail by a number of different mechanisms, such as relaxation of the substrate, which cause warping; corrosive changes in the reflecting layer; cracking or pinholes; changes in the reflection of any dye layers by light, pressure, or crystallization; or breakdown of the disc laminate by adhesion failure and layer separation. Of particular interest to the consumer is how long optical discs will last. Various tests reported that their life expectancy ranges from 5 to more than 100 years, depending on the product.
Appropriate storage conditions can prolong the life of optical discs, regardless of the inherent stability of the material. The recommended environmental conditions are 23 °C and a relative humidity between 20 and 50 percent. Lower levels of temperature and RH provide increased stability, with the lowest specified conditions being -10 °C and 5 percent RH. The standard document (ANSI-PIMA IT9.25-1998) dealing with the storage of optical discs also covers magnetic fields, enclosures, labeling, housing, storage rooms, and acclimatization. Particular care should be given to maintaining a low-dust and low-dirt environment. Another important consideration is to avoid large temperature and humidity variations. Protection from light is vital for many writable CDs.
3.5.4 Accessibility to Data (Off-line Versus Near-line or Online Access)
There are several approaches to image access. For the digital master, file size and security issues drive the decisions on the storage type chosen. Many institutions keep their digital masters off line, (i.e., on tapes or other storage media). In any case, it is advisable to have at least two back-up copies of the master files stored off-line, in different locations, and under recommended storage conditions. Often one version of the master file is stored near-line (e.g., on a tape robot system). If a file is needed, it is retrieved from the tape; this usually can be done in minutes. For the user, it appears that the image is stored online. Sometimes images are not made available for the outside world but are kept behind a firewall to prevent abuse. This might not be necessary in the future, when safer watermarking techniques are available. Online and near-line access is definitely the future for image databases to more rapidly get images to the customers, but solutions such as this are still a few years away. Faster networks with broader bandwidths and solutions to security issues are among the things that are still needed.
It is also important to keep a number of back-ups in different places. Sharing images among various institutions will likewise ensure that images will survive. This idea suggests that new approaches to data security and new copyright laws are needed.
Theoretically, a digital master might not be accessed until the next time the archive is copied onto the next-generation storage medium in a new file format. This will probably occur within five to seven years. At that point, a source code to interpret the data needs to be readily available.
3.5.5 Is Automatic Error Correction and Detection Viable for all Formats?
All digital data is recorded in the form of binary numbers. However, plain binary representation is very rarely used. Rather error correction and data compression are applied, often in combination. The misinterpretation of an on/off switch always leads to a significant error in the interpretation of data. In order to cope with this inherent error, redundant information is added to the plain digital data. A simple form is the parity bit. This method has been replaced by very elaborate error correction codes like the cyclic redundancy check (CRC). CRC not only allows detection of errors but also allows correcting them, if not too many bits within a group have been misinterpreted. The principle of all error correction schemes is to add redundant information. On a hardware level, digital storage devices use error correction in order to guarantee a certain level of data quality. This error correction is performed automatically without the user being aware of it. However, the internal error correction rates (and their development with time) may be an interesting estimate of the quality of a storage medium. Furthermore, it has to be kept in mind, that the error correction scheme needs to be known and documented, if the data is to be readable in the future.
4.0 Documentation
4.1 File Headers
Michael Ester (1996) has written that:
Production and management data consist of all the technical information needed for further processing of an image. One place to put all that information is the file header.Digital images are beginning to stack up like cordwood as museums and archives plunge into more and more electronic application. Yet from a management standpoint, it is not at all clear that collections of digital files are any easier to manage than collections of film and prints. At least with photographic materials, institutions have had decades to develop filing and recording methods. This is not the question of how to describe the contents of an image, which is an entirely separate discussion. Rather, production and management data answer the questions of: what is the source of this image; how was it created, what are its characteristics, where can it be found, and what is it called. Pointers within each record maintain the interconnections among versions of images and where they reside. There is no one time or place where all of this information is acquired: reproduction data are entered when the file is received; image capture variables are recorded during scanning; image characteristics and linking references are added in a subsequent production step.
It still has to be decided what image characteristics should be included in the header. Participants at the NISO/CLIR/RLG Technical Metadata Elements for Images workshop that took place in Washington, D.C. in the spring of 1999 started to address this issue (Bearman 1999). Using targets and including this information in the file will be the best method to go for successful data migration.
A tremendous amount of data are often lost when storing 24-bit data instead of raw data. The higher the quality of the digital master, the more technical data will have to be kept with the images and, probably, stored in the file header. This leads to the conclusion that the file format must be able to store a variable amount of different data in the header.
4.1.1 Advisability of Embedding Gray Step/color Patch Values
Gray step and other target values used during image creation need to be stored with the image file. One way to do this is to keep these values in a separate database and to have a pointer in the file header point to the particular record. However, this approach bears the danger of losing the connection between the values and the image file, since two databases have to be updated and kept over time. In the end, it seems advisable to use a file format that can put these values into the header. It is also advisable to automate this process as much as possible in order to keep things consistent and to keep errors to a minimum while populating the header. Much work remains to be done to make this possible.
Other document information, such as the document name and page numbers, will also have to be recorded. Embedding them into the file header minimizes the chances of losing that information over time. It also makes it easier to distribute images, because only one file, instead of an image file and the database with all the information, has to be shared.
This approach, however, requires that software read all the header information. Standardization will help to do so.
4.1.2 Fitting Documentation into the Workflow
All documentation must be part of the workflow, from the beginning of a project. What is not documented today will probably never be documented.
4.1.3 Populating Headers During Scanning, Post-scanning, or Both?
Headers will have to be populated at several stages during the workflow. Some data, such as details about the scanning process and technical data about the software and hardware being used, will be put there during scanning. After the files are scanned and evaluated, other information, such as processing details, will have to be added.
4.1.4 Pros and Cons of Creating Documentation Outside the File Header
Creating the documentation outside the file header might be necessary for workflow purposes, (e.g., if this information is also needed in other parts of the working environment). This means that a separate database is often being created apart from the database that contains the images. To facilitate migration, it is always advisable to put the information into the file header as well.
4.1.5 Risks of Losing Information in File Headers
The process of populating the file header must be well documented; for example, one must state which field or tag contains what information, and ensure that this is done consistently over time. Doing so will also make it possible to prevent information loss during migration. Images, as well as file header information have to be checked when migrating files. Part of this process might be automatic, but it is always advisable to open some file headers and see whether the information has been transferred correctly.
4.1.6 Controls that Can be Used to Mitigate Potential for Loss During Migration
One way to prevent accidental loss prescribed for TIFF/EPS files is to store them in read-only mode. This will prevent accidental loss of important TIFF/EPS tag-value information if the image is edited by a non-TIFF/EPS-compliant application. TIFF editors generally remove unknown tags when saving or updating an image file to maintain the integrity of the TIFF file, since the unknown tags might not apply to the edited image.
Guides to Quality in Visual Resource Imaging
References
© 2000 Council on Library and Information Resources
- Adelstein, Peter, and Franziska Frey. 1998. 'New Developments on Standards for the Permanence of Electronic Media.' In Proceedings IS&T's 1st PIC Conference, 127-32, Portland, Or. The Society for Imaging Science and Technology.
- ANSI/NAPM IT9.21-1996, Life Expectancy of Compact Discs (CD-ROM)-Method for Estimating, Based on Effects of Temperature and Relative Humidity. New York, N.Y.: American National Standards Institute.
- ANSI/PIMA IT9.23-1998, Polyester Base Magnetic Tape-Storage Practices. New York, N.Y.: American National Standards Institute.
- ANSI/PIMA IT9.25-1998, Optical Disc Media-Storage. New York, N.Y.: American National Standards Institute.
- Austen, Ian. 2000. 'Making Monitors Pass the Screen Test.' The New York Times (Technology/Circuits section), Feb. 10.
- Ayris, Paul. 1998. Guidance for Selecting Materials for Digitisation. Paper presented at the Joint Research Libraries Group and National Preservation Office Preservation Conference, September 28-30, 1998, University of Warwick. Available from http://www.rlg.org/preserv/joint/ayris.html.
- Bearman, David. 1999. NISO/CLIR/RLG Technical Metadata for Images Workshop, April 18-19, 1999. Available from http://www.niso.org/imagerpt.html.
- Blatner, D., and B. Fraser. 1999. Real World Photoshop 5. Berkeley, Ca.: Peachpit Press.
- Brown, C. W., and B. J. Sheperd. 1995. Graphics File Formats, Reference and Guide. Greenwich, Conn.: Prentice Hall.
- Campbell, Laura. 1999. Panel: Standards for Imaging Projects. Electronic Imaging and the Visual Arts (EVA) Conference, The Museum of Modern Art, New York, May 21, 1999.
- Carpenter, Mikki, Linda Serenson Colet, Kate Keller, and Erik Landsberg. 1997-98. 'Direct Digital Capture: Decisions, Decisions! Conclusions???' MCN Spectra 25(2):28-32.
- Carpenter, Mikki, and Linda Serenson Colet. 1998. Managing Digital Imaging Projects (Workshop). Museum Computer Network Conference, Santa Monica, Ca., September 23, 1998.
- Cartolano, Robert, Janet Gertz, and Susan Klimley. 1997. Oversized Color Images: Addressing Issues of Preservation and Access, New York State Museum Bulletins Project. New York State Museum Bulletins. Available from http://www.columbia.edu/dlc/nysmb.
- Chapman, Stephen, Paul Conway, and Anne Kenney. 1999. 'Digital Imaging and Preservation Microfilm: The Future of the Hybrid Approach for the Preservation of Brittle Books.' RLG DigiNews 3(1) (February 15). Available from http://www.rlg.org/preserv/diginews/diginews3-1.html
- Conway, Paul. 1999. Digital Technology Made Simpler. Technical Leaflet: Reformatting, Section 5, Leaflet 4. Andover, Mass.: Northeast Document Conservation Center. Available from http://www.nedcc.org/plam3/tleaf54.htm.
- Dainty, J. C., and R. Shaw. 1974. Image Science, Principles, Analysis, and Evaluation of Photographic-Type Imaging Processes. London: Academic Press.
- Dale, Robin. 1999. 'Lossy or Lossless? File Compression Strategies Discussion at ALA,' RLG DigiNews, 3(1). Available from http://www.rlg.org/preserv/diginews/diginews3-1.html.
- DeNatale, Carole, and Peter Hirtle. 1998. Selecting a Digital Camera: the Cornell Museum Online Project. RLG DigiNews 2(6) (December 15). Available from http://www.rlg.org/preserv/diginews/diginews2-6.html.
- Ester, Michael. 1990. 'Image Quality and Viewer Perception.' Leonardo: Digital Image-Digital Cinema Supplemental Issue, 51-63.
- Ester, Michae.l 1994. 'Digital Images in the Context of Visual Collections and Scholarship,' Visual Resources: An International Journal of Documentation-Special Issue: Issues in Electronic Imaging, Christine L. Sundt, Ed., X (1):25-39. Yverdon, Switzerland: Gordon and Breach Science Publishers SA.
- Ester, Michael. 1996. Digital Image Collections: Issues and Practice. Washington, D.C.: Commission on Preservation and Access.
- Fleischhauer, Carl. 1998. Digital Formats for Content Reproductions (July 13 version). American Memory White Papers. Washington, D.C.: Library of Congress. Available from http://memory.loc.gov/ammem/ftpfiles.html.
- Frey, Franziska. 1997. 'Digital Imaging for Photographic Collections: Foundations for Technical Standards.' RLG DigiNews (December). Available from http://www.rlg.org/preserv/diginews.
- Frey, Franziska, and James Reilly. 1999. Digital Imaging for Photographic Collections: Foundations for Technical Standards. Rochester, N.Y.: Image Permanence Institute, Rochester Institute of Technology.
- Frey, Franziska, and Sabine Süsstrunk. 1999. Color Management Panel: Do you know what color your pixels are? Electronic Imaging and the Visual Arts (EVA) Conference, the Museum of Modern Art, New York, May 20, 1999.
- Frey, Franziska, and Sabine Süsstrunk. 1997. 'Color Issues to Consider in Pictorial Image Data Bases.' In Proceedings IS&T's Fifth Color Imaging Conference, 112-5, Scottsdale, Ariz. The Society for Imaging Science and Technology.
- Frey, Franziska, and Sabine Süsstrunk. 1996. 'Image Quality Issues for the Digitization of Photographic Collections.' In Proceedings IS&T 49th Annual Conference, 349-53, Minneapolis, Minn. The Society for Imaging Science and Technology.
- Frey, Franziska, and Sabine Süsstrunk. 1996. 'Image Quality Issues for Digitization of Photographic Collections.' Very High Resolution and Quality Imaging, SPIE 2663:2-7.
- Gann, Robert G. 1999. Desktop Scanners: Image Quality Evaluation. Upper Saddle River, NJ: Prentice Hall PTR.
- Gertz, Janet. 1995. Oversize Color Images Project: Addressing Issues of Preservation and Access. Revised version (2/5/97) available from http://www.columbia.edu/dlc/nysmb/reports/phase1.html
- Gertz, Janet. 1996. Oversize Color Images Project Phase II, 1996. Available from http://www.columbia.edu/dlc/nysmb/reports/phase2.html
- Gescheider, G.A. 1985. Psychophysics-Method, Theory, and Application, 2d Ed., London, Hillsdale, NJ: Lawrence Erlbaum Associates.
- Gill, Tony, Anne Gilliland-Swetland, and Murtha Baca. 1998. Introduction to Metadata: Pathways to Digital Information. Los Angeles: Getty Information Institute.
- Hazen, Dan, Jeffrey Horrell, and Jan Merrill-Oldham. 1998. Selecting Research Collections for Digitization. Washington, D.C.: Council on Library and Information Resources. Available from http://www.clir.org/pubs/reports/hazen/pub74.html.
- Hedstrom, Margaret, and Sheon Montgomery. 1998. Digital Preservation Needs and Requirements in RLG Member Institutions. Study commissioned by the Research Libraries Group. Available from http://www.rlg.org/preserv/digpres.html.
- Hermanson, Sarah. 2000. Personal communication with Linda Serenson Colet, January.
- Holm, Jack. 1996 a. 'Factors to Consider in Pictorial Digital Image Processing,' Proceedings IS&T 49th Annual Conference, 298-304. Minneapolis, Minn.
- Holm, Jack. 1996 b. 'Survey of Developing Electronic Photography Standards.' In Standards for Electronic Imaging Technologies, Devices, and Systems, 120-52. The International Society for Optical Engineering [SPIE] Critical Reviews of Optical Science and Technology, No. 61. Bellingham, Wa.
- Image Quality Working Group of ArchivesCom, a Joint Libraries/AcIS Committee. 1997 (April). Technical Recommendations for Digital Imaging Projects. Available from http://www.columbia.edu/acis/dl/imagespec.html.
- International Color Consortium. 1999. Available from http://www.color.org.
- ISO 3664. (forthcoming, 1999). Viewing Conditions-for Graphic Technology and Photography.
- ISO 12233/FDIS, ISO/TC42. 1999. Photography-Electronic Still Picture Cameras-Resolution Measurements.
- ISO 12234-2/DIS, ISO/TC42. November 1998. Photography-Electronic Still Picture Imaging-Removable Memory-Part 2: Image Data Format-TIFF/EPS. Available at www.pima.net/it10a.htm.
- ISO 14524/FDIS, ISO/TC42. 1999 (January). Photography-Electronic Still Picture Cameras-Methods for Measuring Opto-Electronic Conversion Functions (OECFs).
- ISO 15739/CD, ISO/TC42. 1999 (June). Photography-Electronic Still Picture Cameras-Noise Measurements.
- ISO 16067/WD, ISO/TC42. 1999 (September). Photography-Electronic Still Picture Cameras-Spatial Resolution Measurements, Part 1: Scanners for Reflective Media.
- ISO 17321/WD, ISO/TC42. 1999 (April). Graphic Technology and Photography-Colour characterization of digital still cameras (DCSs) using colour targets and spectral illumination.
- Kay, David C., and John R. Levine. 1995. Graphics File Formats, 2d ed. Blue Ridge Summit, Pa.: McGraw Hill. Photographic and Imaging Manufacturers Association (PIMA). PIMA/IT10, Technical Committee on Electronic Still Picture Imaging. Available from http://www.pima.net/it10a.htm
- Landsberg, Erik. 2000. Personal communication with Linda Serenson Colet, May.
- Library of Congress, National Digital Library Program. 1997. NDLP Project Planning Checklist (January). Available from http://memory.loc.gov/ammem/prjplan.html.
- Mintzer, Fred C., et al. 1996. Towards On-line, Worldwide Access to Vatican Library Materials. IBM Journal of Research and Development 40(2):139.
- Puglia, Steven, and Barry Roginski. 1998. NARA Guidelines for Digitizing Archival Materials for Electronic Access. Available from http://www.nara.gov/nara/vision/eap/eapspec.html.
- Rhyne, C.S. 1996. Computer Images for Research, Teaching, and Publication in Art History and Related Disciplines. Visual Resources 12(1):19-51. Available from http://www.reed.edu/~crhyne/papers/computer.html.
- Serenson Colet, Linda, Kate Keller, and Eric Landsberg. 1997-1998. 'Digitizing Photographic Collections: A Case Study at the Museum of Modern Art, NY.' MCN Spectra 25(2) (Winter 1997/98):22-27.
- Smith, Leslie E. 1991. 'Factors Governing the Long-Term Stability of Polyester-Based Recording Media,' Restaurator 12:201-18.
- Stephenson, Christie, and Patricia McClung, eds. 1998. MESL: Delivering Digital Images: Cultural Heritage Resources for Education. Los Angeles: Getty Information Institute.
- Süsstrunk, Sabine. 2000. Personal communication with Linda Serenson Colet, May.
- Süsstrunk, Sabine. 1998. 'Imaging Production Systems at Corbis Corporation.' RLG DigiNews, 2(4) (August 15). Available from http://www.rlg.org/preserv/diginews/diginews2-4.html#technical.
- Süsstrunk, Sabine, R. Buckley, and S. Swen. 1999. 'Standard RGB Color Spaces,' In Proceedings IS&T's Seventh Color Imaging Conference, Scottsdale, Ariz.: 127-34. The Society for Imaging Science and Technology.
- Technical Working Group, Visual Information Access Project. 1998. Harvard Library Digital Initiative Image Scanning Guidelines, version 1.0. Cambridge, Mass.: Harvard University. Available from http://hul.harvard.edu/ldi/image_scanning.PDF.
- Yehling Allen, David. 1998. 'Creating and Distributing High Resolution Cartographic Images.' RLG DigiNews 2(4) (August 15). Available from http://www.rlg.org/preserv/diginews/diginews2-4.html#feature.
- Universal Preservation Format. Available from http://info.wgbh.org/upf.
- Van Bogart, John W. 1995. Magnetic Tape Storage and Handling. Washington, D.C.: Commission on Preservation and Access.
- Williams, Donald. 1998. 'What is an MTF? and why should you care?' RLG DigiNews, v.2, no. 1 (Feb. 15). Available from http://www.rlg.org/preserv/diginews.
Further Readings and Web References
- ANSI/PIMA IT9.26-1997, Life Expectancy of Magneto-Optic (MO) Disks-Method for Estimating, Based on Effects of Temperature and Relative Humidity.
- Arms, Caroline, ed. 1999. Enabling Access in Digital Libraries. Washington D.C.: Council on Library and Information Resources.
- Baxes, G. A. 1994. Digital Image Processing. New York, N.Y.: John Wiley & Sons, Inc.
- D'Amato, Donald P., and R. C. Klopfenstein. 1997. An Evaluation of Digital Image Quality Requirements for Illustrations of the Smithsonian Institution, in Very High Resolution and Quality Imaging II, edited by V. Ralph Algazi, Sadayasu Ono, and Andrew G. Tescher. SPIE Proceedings 3025:2-10.
- Gann, Robert. 1999. Desktop Scanners: Image Quality Evaluation. Upper Saddle River, N.J.: Prentice Hall PTR.
- Holst, Gerald C. 1996. CCD Arrays, Cameras, and Displays. Winter Park, Fla.: JCD Publishing.
- International Color Consortium. 1998. File Format for Color Profiles (ICC.1:1998-09). Available from http://www.color.org/ICC-1_1998-09.pdf.
- IP Lab Spectrum. Scanalytics, Inc., 8550 Lee Highway, Suite 400, Fairfax, VA 22031. Phone: 703-208-2230. Information available from http://www.scanalytics.com.
- Kang, H.R. 1997. Color Technology for Electronic Imaging Devices. Bellingham, Wash.: SPIE Optical Engineering Press.
- Maitre, H., F. J. M. Schmitt, and J. Crettez. 1997. High Quality Imaging in Museum: From Theory to Practice, in Very High Resolution and Quality Imaging II, edited by V. Ralph Algazi, Sadayasu Ono, and Andrew G. Tescher. SPIE Proceedings 3025:30-9.
- Mitre Corporation. Information available from http://www.mitre.org.
- NIH Image. Information available from http://rsb.info.nih.gov/nih-image/index.html.
- Olivès, J., B. Lamiscarre, and M. Gazalet. 1997. Optimization of Electro-Optical Imaging System with an Image Quality Measure. In Very High Resolution and Quality Imaging II, edited by V. Ralph Algazi, Sadayasu Ono, and Andrew G. Tescher. SPIE Proceedings 3025:158-67.
- Olsson, S., M. Stroppiana, and J. Baïna. 1997. Objective Methods for Assessment of Video Quality: State of the Art. IEEE Transactions on Broadcasting, 43(4):487-95.
- Puglia, S., and B. Roginski. 1998. NARA Guidelines for Digitizing Archival Materials for Electronic Access. Adelphi, Md.: National Archives and Records Administration. Available from http://www.nara.gov/nara/vision/eap/eapspec.html.
- Russ, C. 1995. The Image Processing Handbook, 2d Ed. Boca Raton, Fla.: CRC Press.
- Scion Image. Scion Corporation, 82 Worman's Mill Court, Suite H, Frederick, MD 21701. Phone: 301-695-7870; fax: 301-695-0035. Information available from http://www.scioncorp.com.
- Sine Patterns LLC, 3800 Monroe Ave., Pittsford, NY 14534. Phone: 716-385-1110; fax: 716-385-9528. Information available from http://www.sinepatterns.com.
- Thorell, L. G., and W. J. Smith. 1990. Using Computer Color Effectively. Englewood Cliffs, N.J.: Prentice Hall.
- Wyszecki, G., and W. S. Stiles. 1982. Color Science, Concepts and Methods, Quantitative Data and Formulae. New York: John Wiley and Sons.
Guides to Quality in Visual Resource Imaging
About the Authors
© 2000 Council on Library and Information Resources
-
Linda Serenson Colet is the senior manager for collection and exhibition technologies at the Museum of Modern Art (MoMA) in New York. She managed the first direct digital capture application at the museum in collaboration with the Photo Services division and the Department of Photography. Ms. Colet is currently responsible for leading a project team to implement a new collections and exhibitions management system for the museum. Designed to be the information backbone of the institution, it will serve as the central source for research, collection and exhibition transactions, and public access. In all projects, she has established data and image standards to ensure that information can be re-purposed for a multitude of applications (from web projects to high-end book production).
In addition to her work at MoMA, Ms. Colet developed extensive curatorial and registrar experience in her capacity as assistant curator of the Reader's Digest Art Collection. She holds an M.A. in Art History and has presented and published on managing digital imaging projects.
-
Donald P. D'Amato is a senior principal scientist in the Center for Information Systems of Mitretek Systems, Inc. in McLean, Virginia. His activities include the specification and analysis of systems involving digital image processing, optical character recognition, color management, biometrics technologies, and electronic document standards. Some of his recent work in imaging has been used by the U.S. Department of State, Federal Bureau of Investigation, U.S. Postal Service, Smithsonian Institution's National Museum of Natural History, Internal Revenue Service, and Patent and Trademark Office.
He has held previous positions at The MITRE Corporation, Arthur D. Little, Inc., Scan Optics, Inc., and the University of Connecticut. Mr. D'Amato received Ph.D. and M.Sc. degrees in nuclear physics from Ohio State University and a B.A. in physics from Ohio Wesleyan University.
-
Franziska Frey is a research scientist at the Image Permanence Institute at the Rochester Institute of Technology. For the past ten years, she has worked on various research projects in the application of imaging methods for photographic collections. Most recently, she has been working on an NEH-funded project, Digital Imaging for Photographic Collections: Foundations for Technical Standards. She is also developing solutions for image production and quality control for digital image databases and is consulting for various museums and government agencies.
Ms. Frey holds a Ph.D. in Natural Sciences (Concentration: Imaging Science) from the Swiss Federal Institute of Technology in Zurich, Switzerland. She has taught, lectured, and published widely on various aspects of electronic imaging and its applications for photographic collections and on digital archiving.
-
Don Williams is a senior research engineer in the Image Science Division of Eastman Kodak Co. and has worked in the area of digital image capture, image processing and imaging performance metrics for the past 20 years. He holds his master's degree in Imaging Science from Rochester Institute of Technology and is a frequent advisor on image capture quality for the library and museum communities. He is an active participant in digital imaging standards committees, currently co-leads the ISO 16067: Spatial Resolution Measurement: Scanners for Reflective Media.
Copyright © 2006 Digital Library Federation. All rights reserved.
Last updated: