|
1
|
- Ann Green, Steve Citron-Pousty, and Marcia Ford
- Social Science Research Services
- Yale ITS Academic Media & Technology
- Sandy Peterson and Julie Linden
- Yale Social Science Libraries and Information Services
- Christopher Udry
- Professor, Yale Dept of Economics
- Director, Economic Growth Center and Dept of Economics
|
|
2
|
- Build a prototype archive of statistics not born digital.
- Implement standard digitization practices and emerging metadata
standards for statistical tables.
- Document the costs and processes of creating a statistical digital
library from print.
- Build the collection based upon long range digital life cycle
requirements.
- Present the prototype digital library to the scholarly community for
evaluation.
|
|
3
|
- What effect does online access to the statistical information have on
scholarly use of the materials?
- Are common digitization practices and standards suited to
statistically-intensive documents?
- What are the long term preservation requirements of the EGCDL?
- What are the costs of producing high quality statistical tables with OCR
and editing?
- How scalable is this process, for what kinds of collections, and for
what purposes?
|
|
4
|
- Why Economic Growth Center collection?
- extraordinary wealth of statistical material in printed form
- condition of paper is poor; preservation concerns
- a range of access problems imposed not only by non-digital physical
formats but also by inadequate descriptions of the contents of the
publications
- Why Mexico?
- Faculty connections, library strengths, image quality and completeness
of collection
- Publisher: Instituto Nacional de
Estadística, Geografía e Informática (Mexico, INEGI) Anuarios Estatales
|
|
5
|
- Vendor review:
- Part one: request for proposals
(13 vendors)
- Part two: production of samples
and extended proposals (6 vendors)
- Part three: final review and
budget evaluation
- Part four: contract negotiation
and processing
- Prepared and shipped 221 volumes in Fall ’03
- All materials received back at Yale Feb ’04
- Quality assessment period complete March ’04
|
|
6
|
- 300 dpi TIFFs of each page of each volume, including cover and back of
volume
- (103,115 TIFF files; 460 gigabytes)
- Color TIFFs for color pages, black and white TIFFs for pages with only
black and white
- PDF image + text files of each chapter of each volume (5,607 files)
- Separate files for each subject chapter, front matter, indices, and
back matter
|
|
7
|
- Excel tables (16,488) of demographic and economic tables for 1994, 1996,
1998, 2000
- Selected OCR’d statistical tables converted to Excel format
- DSI operators reviewed each table twice
- Custom tagging done by DSI improved ability to extract columns and rows
into online database and build XML metadata
|
|
8
|
- Overall assessment was very good; minor problems on a very small number
of pages
- Sampled 5% of the PDFs
- subjective review of image:
- Tilting, cut off text, illegible characters, bleed through, color
evaluation, noise
- Vendor did not produce PDFs exactly to our specification, had to
reformat 216 files
|
|
9
|
- Visual review
- Checksums:
- Wrote script to find tables with ‘Total’ columns
- Wrote Excel macro to compare column sums with Total values
- Excellent numeric transfer of numbers from print
|
|
10
|
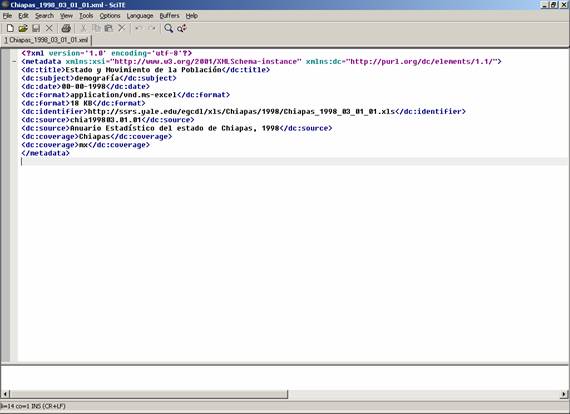
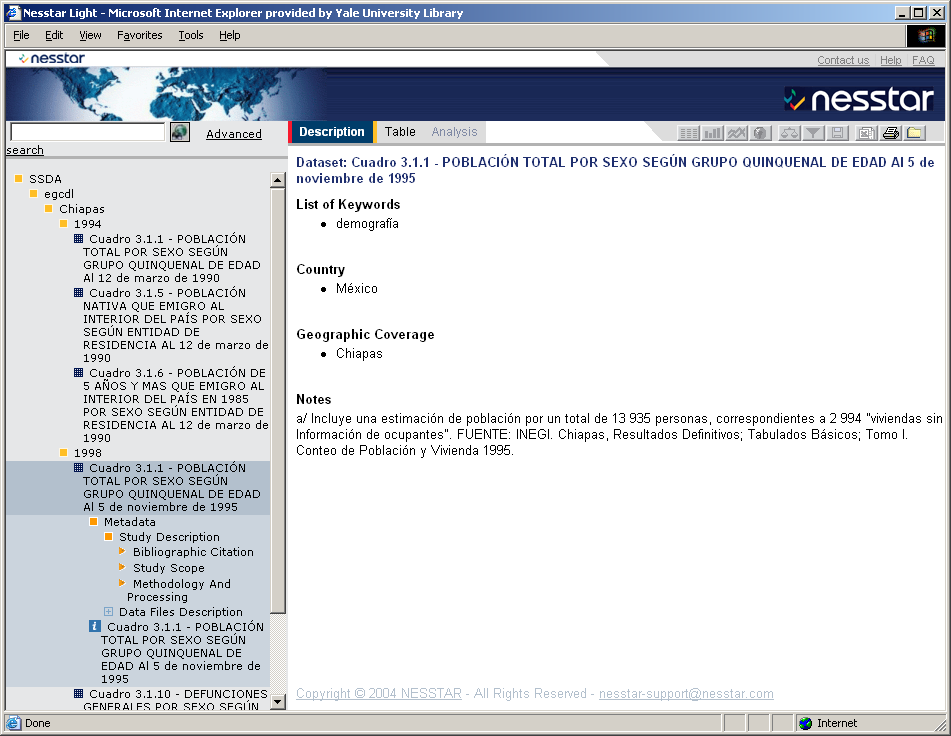
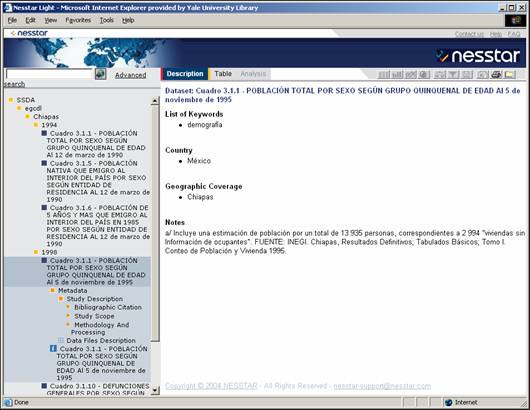
- Defined metadata format for PDF and Excel documents
- Dublin Core subset (title, date, format, identifier, source, coverage,
subject)
- Wrote scripts to produce individual metadata records for each PDF
chapter and each Excel file
- Matched chapter numbers with chapter titles: created standard matching
tables
- Generated subject term for each chapter: created standard tables of
chapter titles to topic list
- Generated series title list from library online catalog
- Other text generated from file name and directory information
|
|
11
|
|
|
12
|
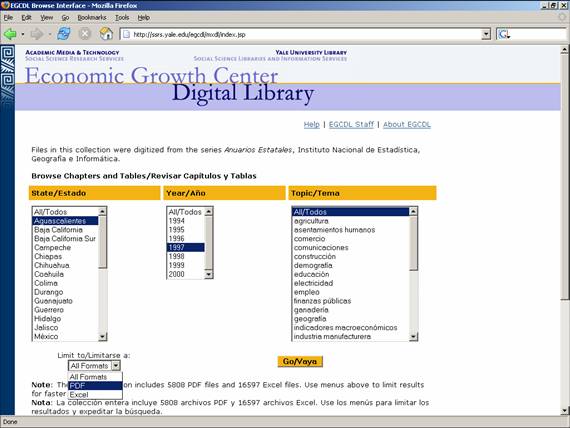
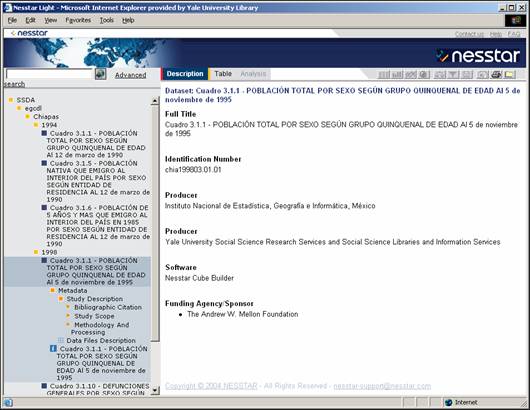
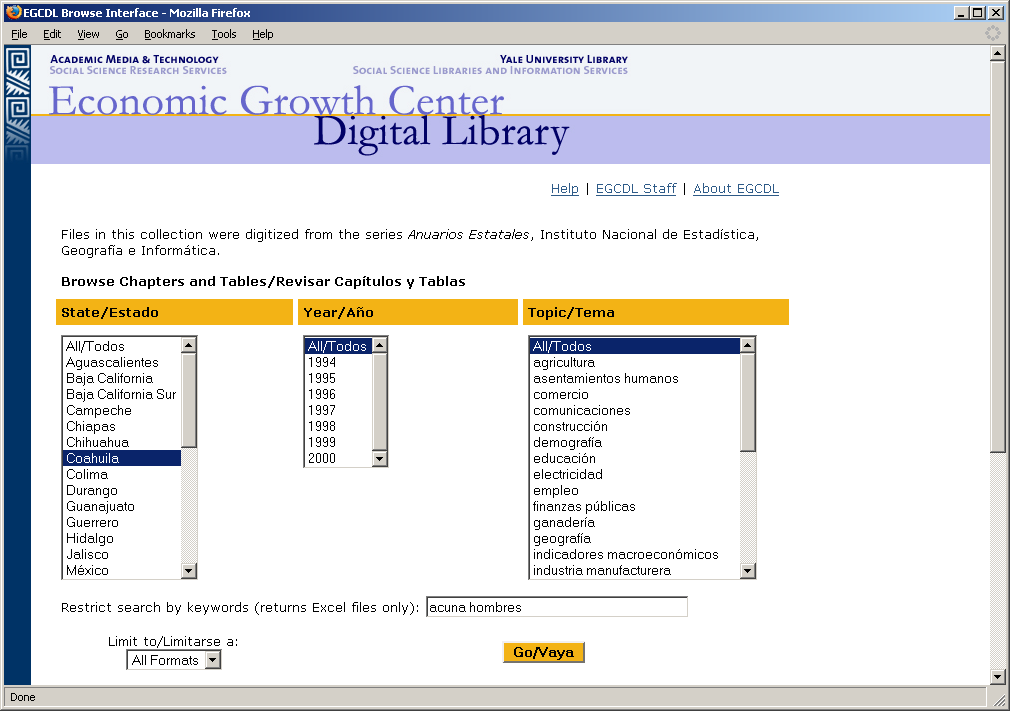
- Features:
- Select files by year, state, topic, and/or type of file (PDF or Excel)
- Reconstruct the full volume
- Based upon Dublin Core metadata
|
|
13
|
|
|
14
|
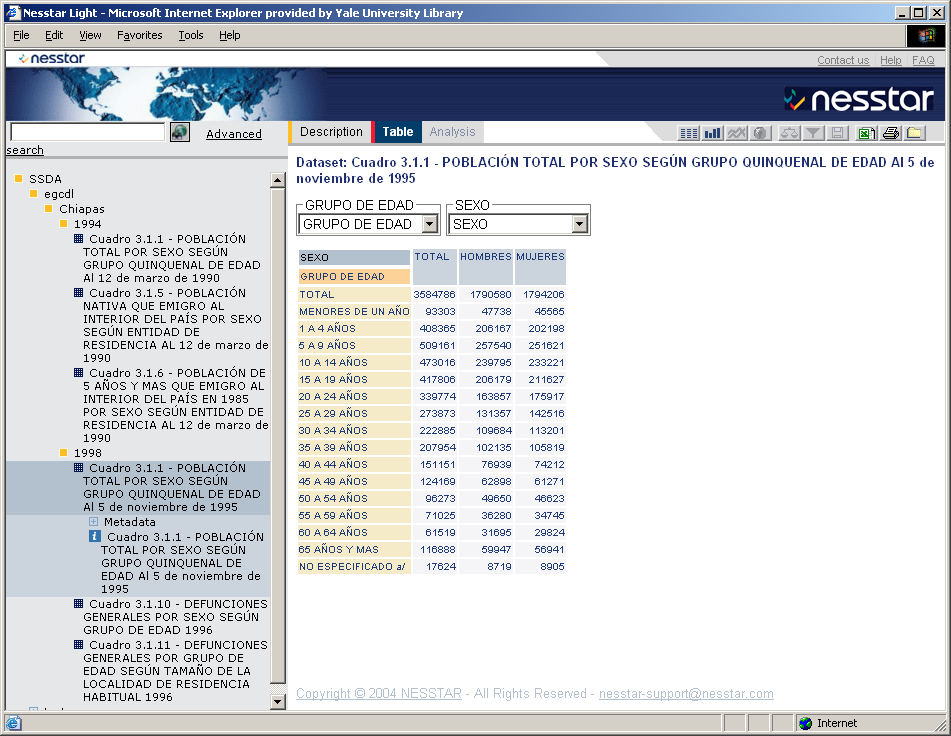
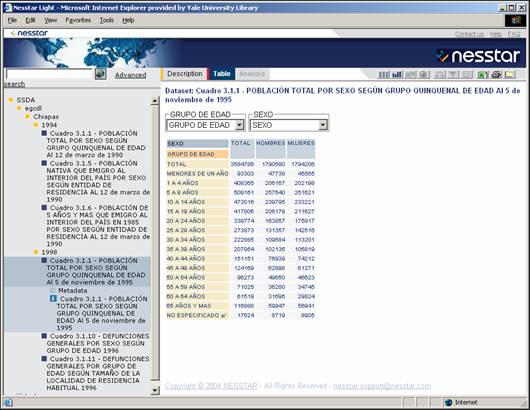
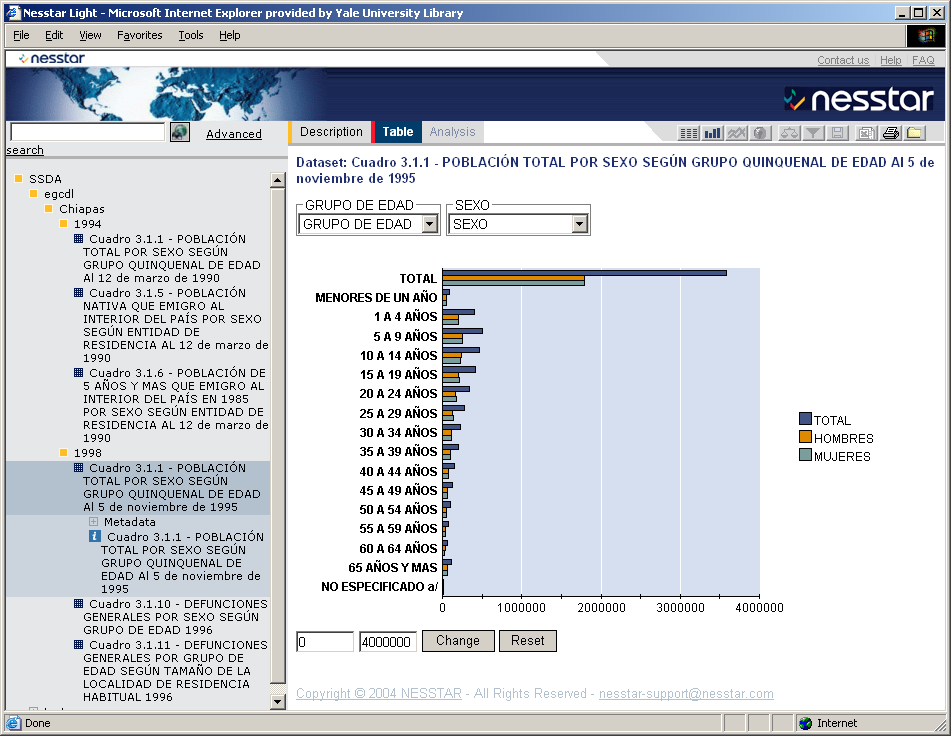
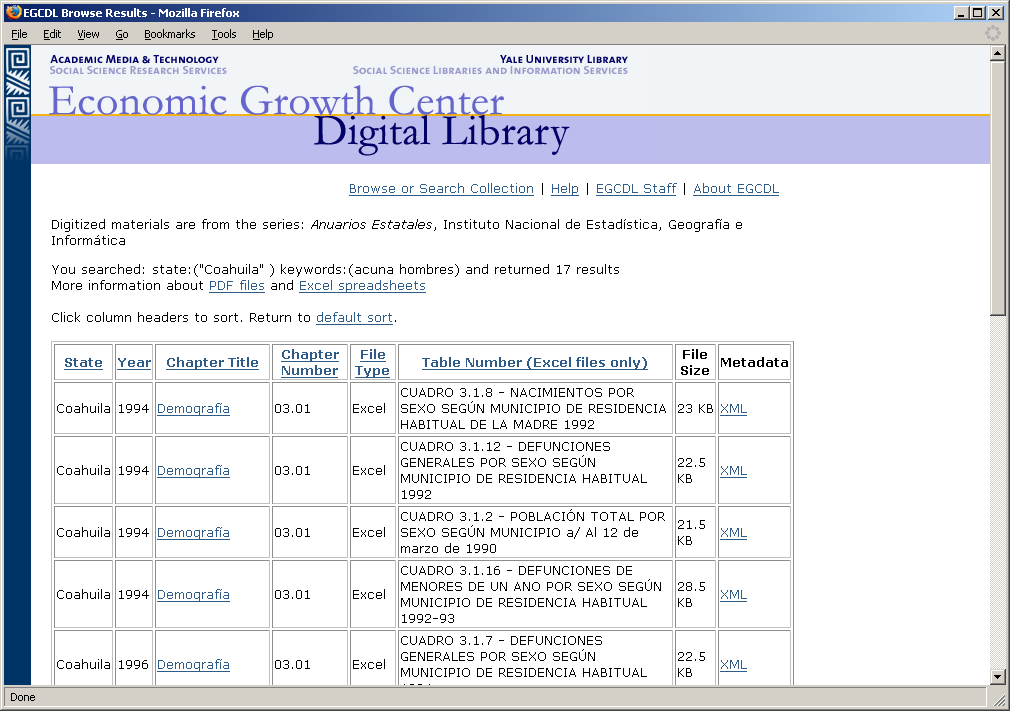
- Features:
- Search across tables
- View tables, select columns and rows
- Create graphs and charts
- Download and extract
- Based upon the Data Documentation Initiative (DDI) metadata standard for
statistical tables
- Uses statistical software similar to SPSS
- Nesstar is in use by data archives in Europe, World Bank, Health Canada;
in review by ICPSR and The Roper Center
|
|
15
|
- Script creates DDI XML file from Dublin Core record and CSV file from
Excel table
- Staff publish each pair of DDI XML file and CSV file using Nesstar ‘cube
builder’ software
- Some editing needed at this stage:
- Add ‘measure’ (what the table is measuring—persons, events, pesos, etc)
- Add column header name
- Publish metadata and table data to Nesstar server
|
|
16
|
|
|
17
|
|
|
18
|
|
|
19
|
|
|
20
|
- No major advantage over Excel in terms of viewing or manipulating data
- Metadata and table can’t be viewed together
- De-contextualization of tables (search results don’t indicate what
volumes the tables belong to)
- Lack of flexibility in customization
|
|
21
|
|
|
22
|
- Labor-intensive to create and edit; no batch processing
- Have to interpret table elements (add column header and measure labels)
- Some data lost (textual codes for missing data; footnotes within cells)
- Some deviations from DDI specification
|
|
23
|
- Scripts pulled elements from Excel files and Dublin Core records
- No manual editing necessary
- DDI records are valid
- Metadata describes table “as is” without our interpretation imposed on
it
- Challenges with marking up hierarchical tables in DDI
|
|
24
|
- Lucene index for keyword searching
- Includes text from table titles, column and row labels, and footnotes
- Can use accent marks or not in search terms; Lucene returns appropriate
results set
|
|
25
|
|
|
26
|
|
|
27
|
- Costs and processes of digitizing paper and building a statistical
digital library:
- Scanning requirements (TIFFs, PDF/a, etc)
- OCR of Spanish text
- OCR of numbers into spreadsheets (zoned scanning)
- Quality assessment
- Is it less expensive to key in the tables? What is the ‘tipping point’?
|
|
28
|
- Sent sample tables to two vendors and asked for cost estimates for
keying
- Varied widely – different pricing structures (per 1000 characters vs.
per Kb)
- Both require shipping volumes (or photocopies) overseas
|
|
29
|
- Many volumes have poor quality paper and print
- mimeographed copies of typewritten pages
- skewing, bleed through, strikeovers, text cut off
- Goals of project
- Try to find “tipping point” for digitizing collection vs. digitizing
selection of tables
- Test whether lessons learned from relatively clean tables apply to
lower-quality print materials
- Determine how these materials would fit into EGCDL UI
- Cost estimates
- Considering TIFF and PDF for all volumes, flagging good quality volumes
for automated conversion to Excel
|
|
30
|
|
|
31
|
- Digital Life Cycle considerations:
- Formats and metadata standards
- Long term home for digital assets and the Rescue Repository
- Exactly what assets do we preserve?
- Questions about versioning
- XML to Excel as potential preservation format
|
|
32
|
- Metadata production: extensive use of automated processes
- Dublin core for file level metadata
- DDI for table level metadata
- User interface development and Spanish character challenges
- Nesstar implementation for aggregate data
- Developed own UI for more flexibility, ability to include PDFs and
Excel tables
|
|
33
|
- Scholarly use of the EGCDL:
Finding and accessing tables
- Great advantage in locating data content by the full text of the
tables; value in online access to individual tables.
- Integrate searching and access into existing resources
- Are investments in online analysis and visualization worth it? Are Excel tables what faculty and
students want?
|
|
34
|
- Production of more tables:
- Do faculty value a collections based digitization effort or is there
more value in on demand service?
- What other countries in the EGC print collection are of interest?
- Cost comparisons of building full volume equivalents vs selected
tables.
- The process can be leveraged to facilitate production for other
research and learning projects.
|
|
35
|
- ann.green@yale.edu
- julie.linden@yale.edu
- sandra.k.peterson@yale.edu
- Project web site:
- ssrs.yale.edu/egcdl
|

 Notes
Notes